
Bottom Trend Analysis And Dark Pools
It used to be that technical analysts identified two trends, the uptrend and the downtrend. If the market or a stock was not trending up or down, it was termed “trendless.” In those days the sideways trend was not considered an important factor for entry and exit analysis, and scant studies or theory work was done on the sideways trend. This was because before the advent of Dark Pools, High Frequency Traders HFTs, Alternative Trading Venues, fragmented markets, and highly complex algorithms for order processing the sideways action and sideways bottoming trends was not common.
Nowadays the most important Technical Analysis retail traders need to learn to properly analyze is the sideways trend. There are a variety of types of sideways price action and each is indicating something entirely different based on Market Condition Analysis at the time of the stock pick selection.
In March of 2015 the chart example below for Five Below, Inc. (NASDAQ: FIVE) had a Shift of Sentiment™ pattern, that clearly and easily showed the Dark Pools had entered this stock and would quickly take control of price.
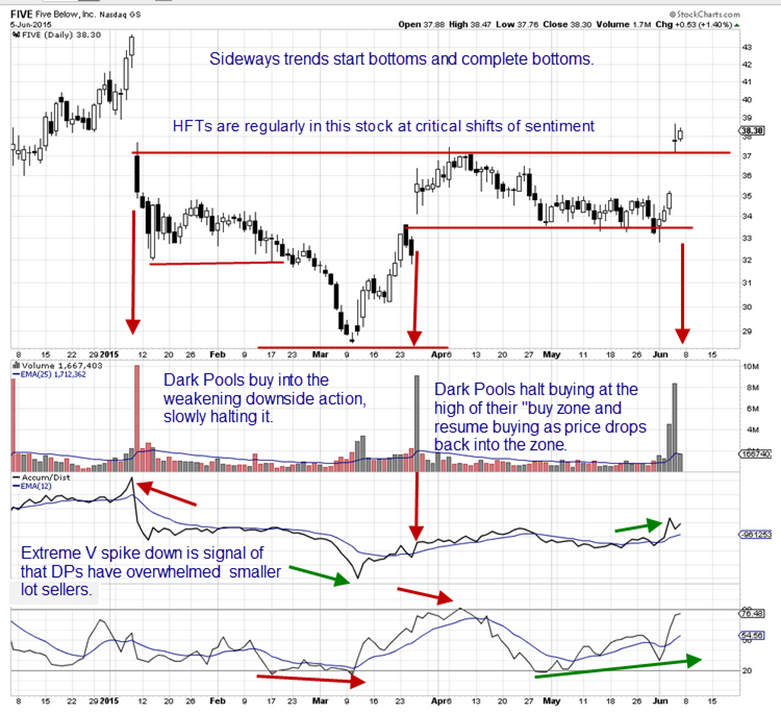
Sideways bottoming trend analysis of the chart shows a sudden reversal occurred when Dark Pools move in quietly, even while the price continued downward for a brief period after the Shift of Sentiment. Dark Pools prefer to buy into the bottoming weakness when sellers are running out of capital to trade.
HFTs were also present in this stock prior to and during the entire bottoming phase. Sideways bottoming trend analysis easily shows their gap down huge volume on the Volume Histogram in a middle chart window in late January, as shown by the first red arrow on price to the left. Their presence is also shown by the huge volume spikes in March and June as indicated also by red arrows on price. These HFTs were using 3 different kinds of their most popular strategies.
Sideways bottoming trend analysis reveals although the Platform candlestick pattern developed in April to June after the stock price moved beyond the Dark Pool “buy zone,” it only slipped to fill the prior gap before halting firmly within the lows of the “buy zone” established at that higher level. The Accum/Dist indicator in a middle chart window shows the steady accumulation during April to June. The higher V formation on this indicator provided early indication for the potential of a HFT gap up, allowing Swing traders an earlier entry.
The stock gapped at a technical level as HFTs are currently employing more Technical Analysis in their formulas so they can track small lots, retail traders, and technical traders with more accuracy. Pro traders were also active in this stock prior to the gap.
This is a common bottoming formation for the short term correction, and sometimes for an intermediate term correction.
Summary
Downward Island gaps are often triggered by HFTs, which occurred with this stock chart example. The bottom is most often a short term V that recovers rapidly back up to the prior gap area, then pauses and trends sideways. Identifying patterns of sideways bottoming trends early on, allows for more trades during the bottoming phase.
Trade Wisely,
Martha Stokes CMT
www.TechniTrader.com
info@technitrader.com