
Monitoring purposes SPX: Flat.
Monitoring purposes GOLD: Flat
Long Term Trend monitor purposes: Flat
Timers Digest recorded the Ord Oracle #6 in performance for 6 months updated June 1, 2015.
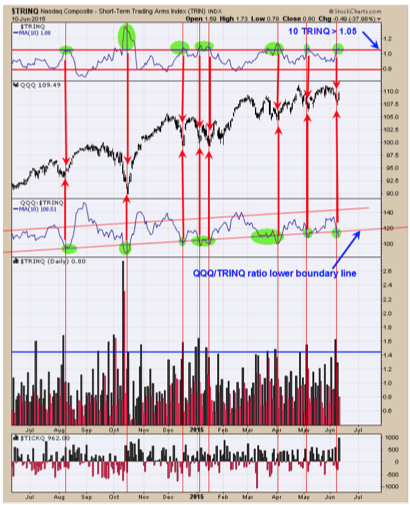
The 10 day TRINQ and the QQQ/TRINQ ratio are giving bullish signs but not the 10 day TRIN and the SPY/TRIN ratio. Which one is right? Most likely if the market does pull back here the 10 day TRINQ and QQQ/TRINQ will remain in bullish territory and stay on a buy signal and if the QQQ go up so will the SPY. With the QQQ on a buy signal it looks as though a decline of any magnitude is not in the cards. The week before option expiration week can produce whipsaws so for now we will remain neutral the market. In the end a bullish resolution will be the final come in our view.
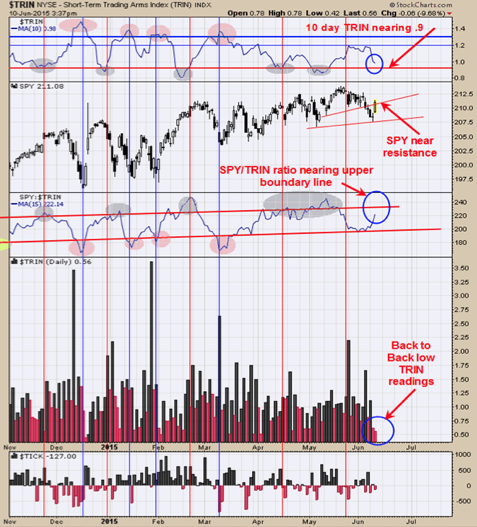
Next week is option expiration week and FOMC meeting is Tuesday and Wednesday and could lead to an interesting week. Market bottoms are formed in panic and the TRIN and TICKS help to identify panic levels. Panic levels in the TRIN are with readings above 1.50 and for Ticks readings below -300. The best bottoms form in the SPX is when the 10 day average of the TRIN closes above 1.30 and the 15 day moving average of the SPY/TRIN ratio closes below the lower boundary line (See chart above) and we did have that are this go around. With yesterday’s and today’s low TRIN reading, both the 10 day TRIN and the SPY/TRIN ratio are nearing the bearish levels. On yesterday’s report we said, “Market could bounce here but final low still lies ahead. A bounce to 210 on the SPY is possible before heading lower.” Today’s rally was and 80% up day which means more than 80% of the volume was on up issues and a bullish sign. However over the last several months an 80% up day have lead to short term tops and failed to follow through. If this 80% up day manages to follow through could turn the trend back to short term bullish. Market can made short term reversals around news events and next Tuesday and Wednesday is the FOMC meeting. Staying neutral for now.
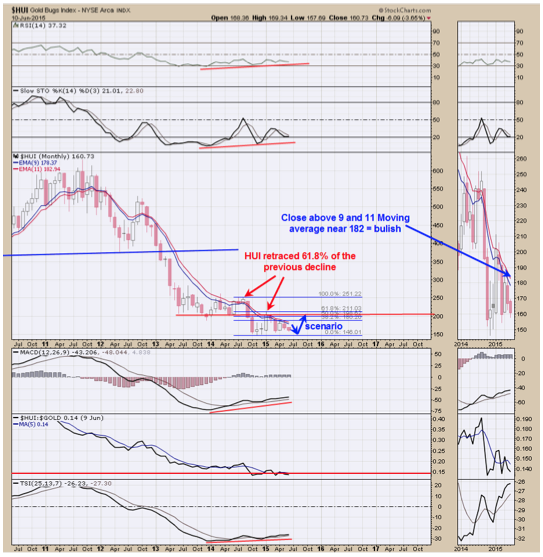
The GDX is in a modest downtrend in a dull fashion and not give a lot of information so we are looking at the big picture. Above is the monthly HUI chart with its monthly RSI, Slow Stochastics, MACD and True Strength index of which all are showing a positive divergence. This monthly positive divergence is suggesting HUI is heading to a longer term bottom. To suggests the HUI has made a bottom the 9 and 11 monthly moving average on HUI needs to turn up. As you can see on the chart above that has not happen but a close above 182 would be a bullish sign. The rally in January retraced 61.8% of the previous decline and suggests the next time down, HUI should find support at the previous lows which comes in near 146. If HUI does find support at the 146 range and bounces above 182, a bullish longer term sign could develop if the monthly RSI, Slow Stochastics, MACD and True Strength index keeps the positive divergences. Still expecting a longer term low to form in the July to August timeframe. We will remain neutral for now.
Tim Ord,
Editor