
Monitoring purposes SPX: Long SPX on 6/3/15 at 2114.07.
Monitoring purposes GOLD: Flat
Long Term Trend monitor purposes: Flat
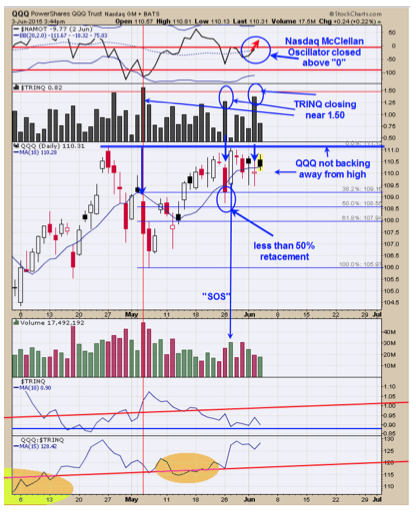
On May 26 a TRINQ closed near 1.50 which is in the bullish region for the QQQ. Yesterday’s TRINQ reading also closed near 1.50 and add to the bullish picture. The rally on May 27 produced a “Sign of Strength” suggested at some point QQQ will break above the highs. The Nasdaq McClellan Oscillator closed above “0” with a close of +44.71 today and another bullish sign. From the low of May 6 to the high of May 22 the QQQ managed only to retrace less than 50% which suggests at some point rally will continue higher. Also the QQQ has not backed away from the recent highs near 111.00 levels and suggests market will “eat’ through that high. If QQQ starts to move higher so will the SPY. Employment numbers come out on Friday and may put short term volatility in the market but when the dust settle market should move higher. Long SPX on 6/3/15 at 2114.7.
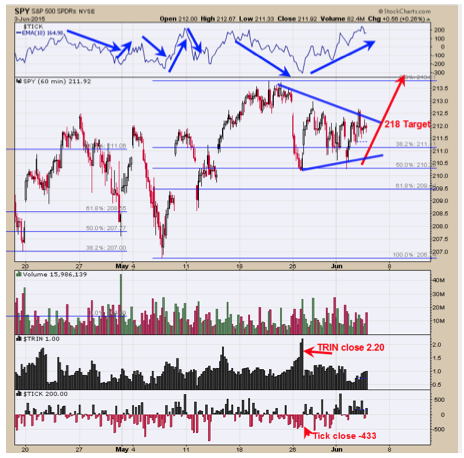
Yesterday we said, “Market bottoms are formed with panic and panic readings where recorded on May 26 in the TRIN and TICK at levels of 2.20 and -433 respectively.” Some time the panic lows are tested and exceeded just a bit before market heads higher. Yesterday’s low came close of touching the May 26 low and may have fulfilled that objective. The chart above is the hourly SPY chart. From the May 6 low to the May 20 the SPY retraced 50% of the previous rally and found support. The pattern that appears to be forming is a “Triangle” pattern which normally forms at the half way point of the move. If that turns out the case there than an upside target of 218 is possible on the SPY and 2180 for the SPX. The top window is the hourly Ticks readings with a 10 period moving average. From the May 26 low the Ticks have been moving higher as the SPY has been moving sideways suggests the SPY will start to move higher as the Ticks usually leads the way. Even if the SPY does touch the May 26 low before heading higher the Tick most likely will make a higher low and keep a bullish divergence.
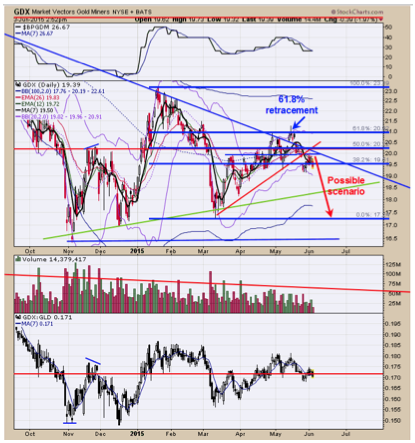
We have a cycle low due in July or August and could represent a longer term bullish setup for the gold markets. The chart above is daily GDX. On May 26, GDX gapped down through four support lines near the 20.00 level. GDX has rallied back near this previous support level and should now act as resistance. For some reason the GDX rallies back through the 20.00 level would turn the trend back to bullish. Form the Top in mid January to the low in mid March GDX rallied over a 61.8% retracement to the mid May high. Normally when a market rallies 61.8% or greater retracement of the previous decline, the market usually finds support at the previous low and in the current case would come in near the 17.25 range and a possible target for the next low. The employment numbers come on Friday at 8:30 Eastern and may have a short term impact on the markets. However, at the moment GDX is below all four trend line support levels near the 20.00 range and a bearish resistance level. We will remain neutral for now.
Tim Ord,
Editor