
List of Indicator Signals Revealed Rotation
Disney stock has been under Quiet Rotation™ for over a year as Giant Funds quietly and slowly reduced the number of held shares in their portfolios using Dark Pools, in expectation of a slow-down for Disney business. All businesses have an internal cycle. Being able to identify when that cycle poses a high risk for a huge High Frequency Trading gap down is an important skill all Retail Traders and Technical Traders need to develop, in order to recognize the dynamics of a High Frequency Trading gap down forming prior to the gap occurring.

The stock chart example below of Disney Corp (NYSE: DIS) shows an obvious pattern for a high risk of a HFT gap down in several levels of analysis.
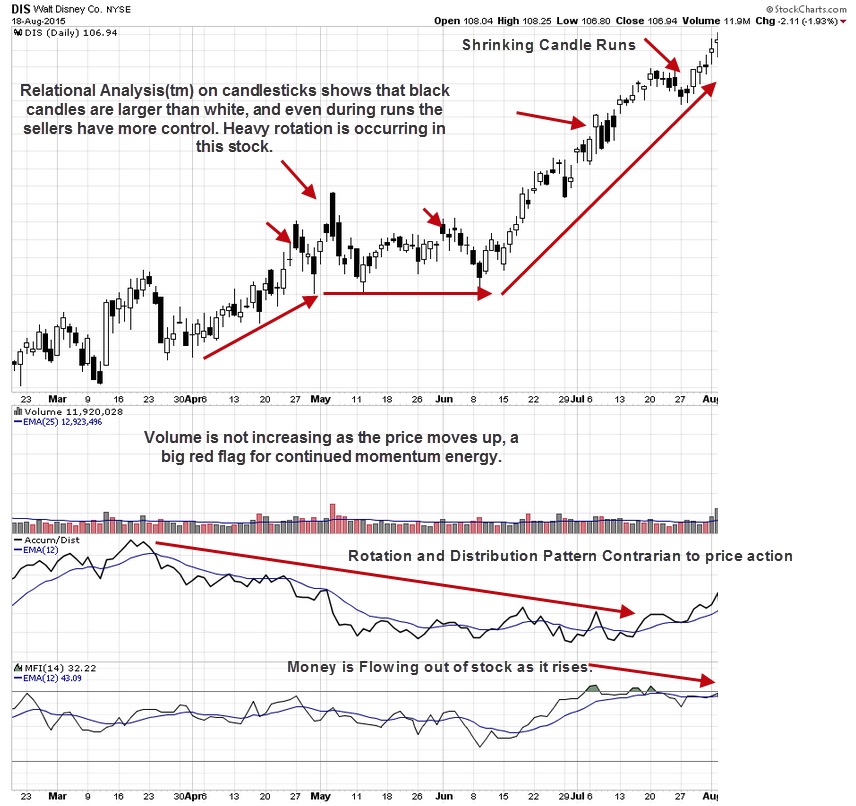
First of all the stock started to lose the steady upside Moderate Uptrend, and the trend started shifting sideways with less upside momentum. Runs began to deteriorate faster. More and longer black candles formed while white candles became smaller, less consistent, until tiny indecision days ended the Uptrend prior to the 12 point gap down. This was caused when HFTs triggered massive quantities of sell orders prior to market open, on company news of weaker Earnings. The Angle of Ascent™ for price was too severe to sustain, also warning of high gap risk during Earnings Season.
Here is a list of the Indicator signals that revealed rotation, and the increasing risk of an HFT gap down on Earnings News:
1. Volume Indicator did not increase and rise as the stock moved up but remained below or at a low average level, as the stock climbed from 106.00 a share to 122.00 a share prior to Second Quarter Earnings release.
2. Accum/Dist Indicator clearly shows the steady rotation, which reduced the giant funds inventories of this stock from a high of 80% percent Institutional Ownership to the current 65% Institutional Ownership.
3. Flow of Funds Indicator peaked at an extreme 3 times before declining as Smaller Funds capitulated after the dynamics of a High Frequency Trading gap down caused a 12 point gap and created a sudden Distribution pattern.
HFTs traded the stock 2 days in a row with huge volatility present each day, in the early minutes of the market open.
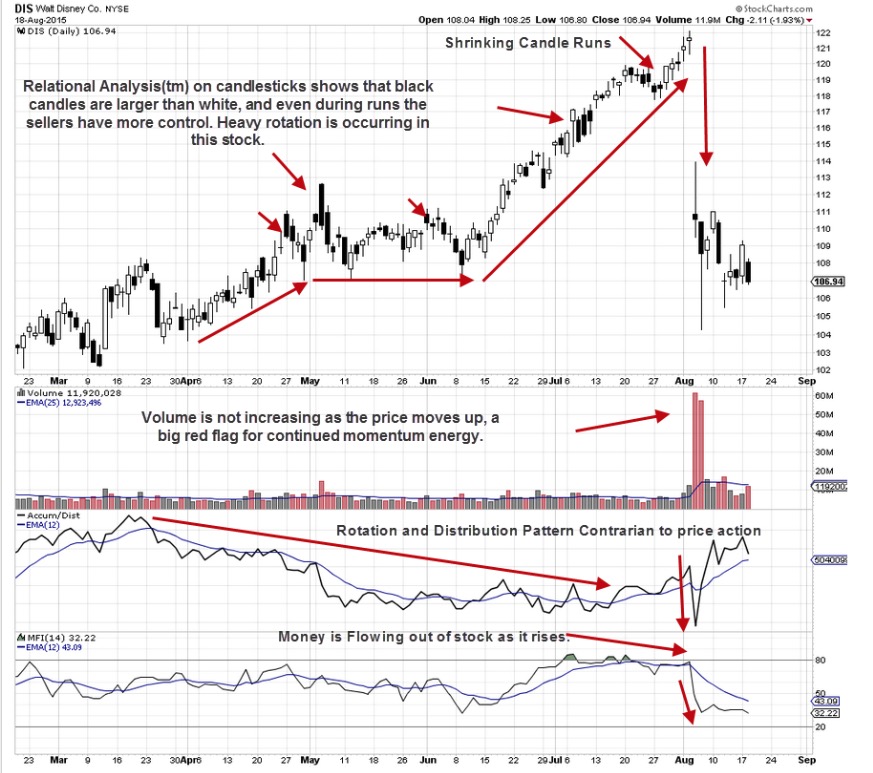
Many Retail Traders and Technical Traders as well as Long Term Investors were caught by surprise by the huge gap down, however the chart clearly revealed the substantial risk of a gap down as it reported Earnings.
Summary
Candlestick patterns in a relational analysis comparison of runs, down days versus up days, length of runs, duration of runs, and individual candlestick patterns as well as the steep Angle of Ascent™ in July and August all warned the stock was at extreme speculative levels going into its Earnings Report. Given that the overall Earnings Season for blue chip stocks was expected to be poor, exiting the stock prior to Earnings was necessary to avoid HFT selling on weaker Earnings News.
All indicators showed the Rotation patterns and a weakness for buyers, indicating the impending dynamics of a High Frequency Trading gap down forming. Sellers were in control, allowing price to move up as they slowly rotated out of the stock, well ahead of the sudden Sheer Cliff Topping Formation™ that HFTs create.
Trade Wisely,
Martha Stokes CMT
www.TechniTrader.com
info@technitrader.com