
Monitoring purposes SPX: Sold long SPX on 7/16/15 at 2124.29= gain 1.05%. Long SPX on 6/25/15 at 2102.31.
Monitoring purposes GOLD: Flat
Long Term Trend monitor purposes: Flat
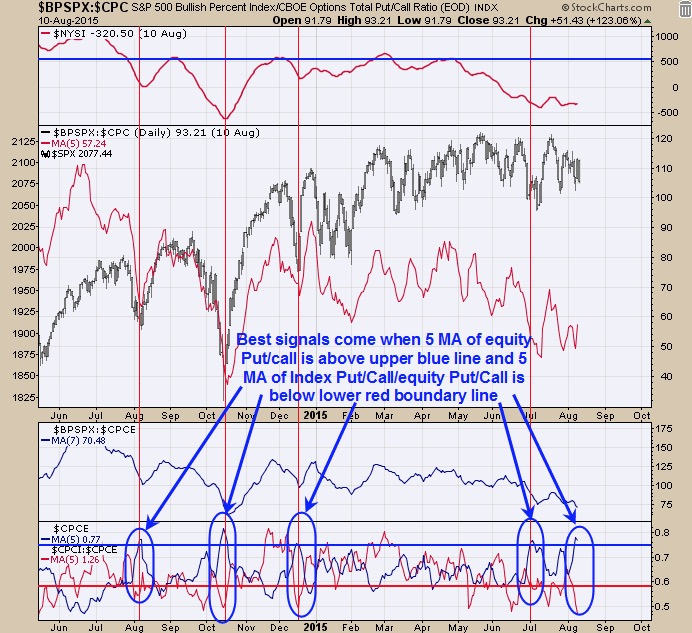
In yesterday’s report, we said, “This is the week before option expiration week and a week where whipsaws are common. This is the week where a low is formed and expiration week is where market usually rallies.” Today’s big turnaround can be classified as a “Whipsaw” and we are still expecting a low to form this week. The bottom window in the chart above is the 5 period moving average of the Equity put/call ratio (in blue) and the 5 period moving average of the index put/call/ equity put/call (red line). The best signals for a bottom in the market come when the blue line is above the upper blue boundary line and the red line is below the lower red boundary line (like now). When these conditions are met than market is usually within a day or two of a bottom.
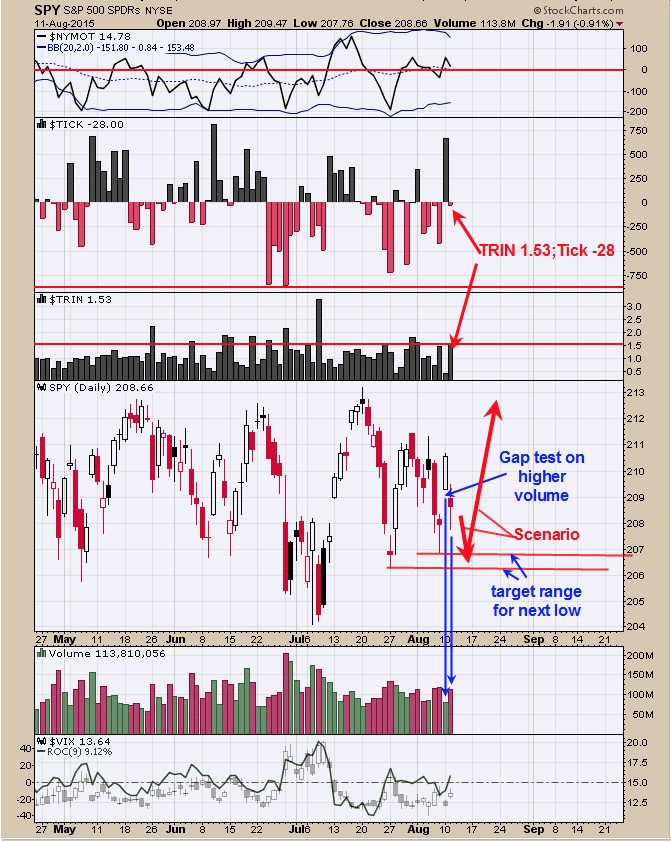
On yesterday’s report we said, “However we don’t believe the up-trend has started from Friday’s low. A test of last Friday’s low is possible if not the July 27 low near 206 on the SPY. Today’s rally produced a 30% decrease in volume compared to Friday volume and not a show of Strength. Also the TRIN closed at .40 and ticks at +667 which can be short term exhaustive. The last time the TRIN and TICKS came close today’s reading appeared on June 10 with Tick close at +805 and TRIN close of .50 and the next day was a high and market retraced near 100% of the previous up move. There is a possibility the same thing may happen here.” Today the market did pull back and the pull back may have further to run. Today’s decline tested yesterday’s gap up and tested on higher volume suggests the gap does not have support and a move lower is possible. Today’s TRIN closed at 1.53 and at panic levels, however the Tick closed at -28 and not at panic levels which should reach panic levels when a bottom is near. An ideal level for the ticks to reach panic levels is the 207 to 206 level which is Friday’s low and the June 27 low respectively. Signal is incomplete.
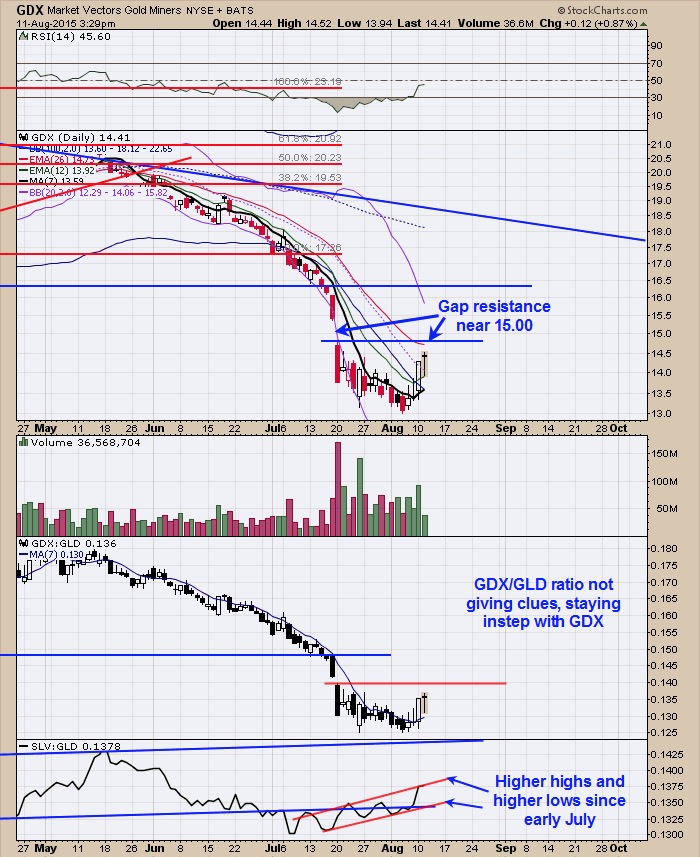
The COT report for last Friday showed the Commercials short at -14,820 and the previous week at minus 21,584 contracts. It has been a bullish sign for gold when the Commercials are less than 50,000 contracts short. Over the last two weeks with the Commercials reducing the shorts even more is a bullish sign. The Small Speculators are net short 15,080 from last Friday’s reading and up form 6,695 contracts the previous week. It has been a bullish sign for gold when the Small Speculators are net short contracts for gold and they have over doubled their short bet from last week. The chart above is the daily GDX. The bottom window is the Silver to gold ratio using the ETF which is SLV/GLD ratio. It’s a bullish sign for both gold and silver when silver is outperforming gold and that happens when this ratio is rising. This ratio has been making higher highs and higher lows since early July. There is a gap near 15.00 on GDX and this gap had high volume. If the gap is tested on lighter volume than gap has resistance and if tested on higher volume market may continue past the gap. GDX has not reached the gap level yet, but most likely this time around the gap will provide resistance and back away. It does appear a bottom process has begun. We are still expecting a bullish outcome but still neutral for now.
Tim Ord,
Editor
For examples in how "Ord-Volume" works, visit www.ord-oracle.com. New Book release "The Secret Science of Price and Volume" by Timothy Ord, buy on www.Amazon.com.