
Monitoring purposes SPX: long SPX on 8/21/15 at 1970.89.
Monitoring purposes GOLD: Flat
Long Term Trend monitor purposes: Flat
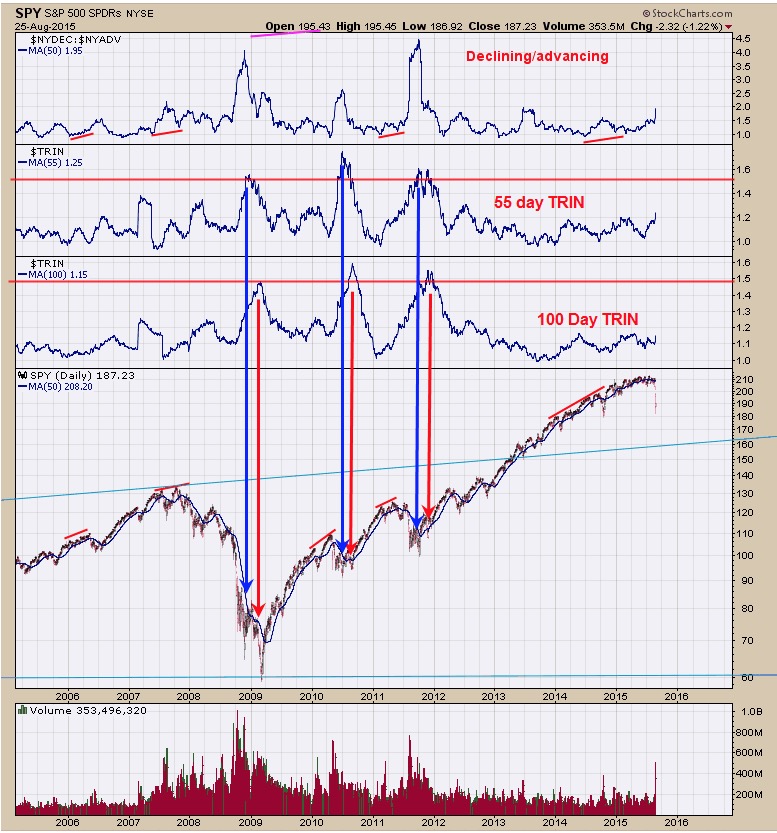
It appears a bear market has started. The above charts will help to pick out the next major low. Its way early looking at this chart as this “bear” could last a while but it gives a “heads up” when the next major low is nearing. This chart goes back to 2005 and shows where the 55 day TRIN and 100 day TRIN topped out (and when market bottom out). When both the 55 day and 100 day TRIN reaches above 1.50 the market is nearing a major low. Market bottom is completed when these two moving averages turn down. The 55 day TRIN normally turns down first giving a warning the bottom is near and when the 100 day TRIN turns down the bottom is in. We will be watching these two indicators closely as the market works lower. The 55 and 100 day TRIN picked out the 2009, 2010 and 2011 bottoms (see chart).
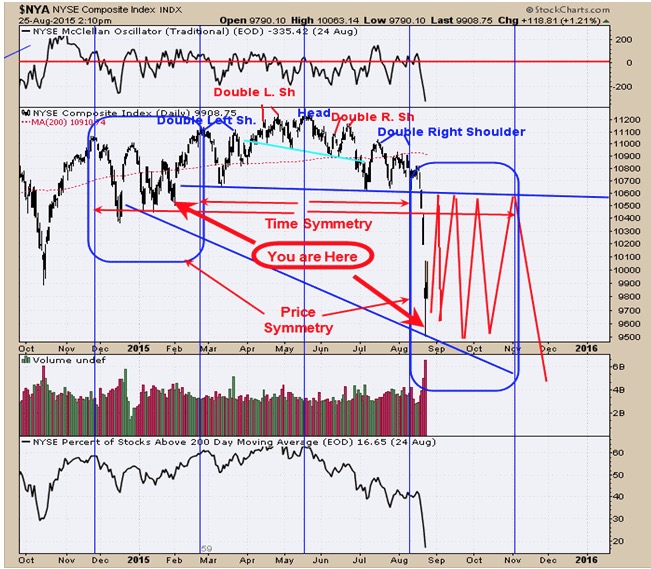
The Head and Shoulders pattern that we talked about on the August 18 report worked out and as predicted. However, we didn’t get our indicators to line up for the sell. On previous reports discussed the symmetry in price and time. The blue vertical lines show symmetry in time where the Head ( of the Head and Shoulders top) is the center line and the time from the Double Left shoulder to the Head is equal to the Head to the Double Right shoulder. As you can see on the chart it worked pretty good for timing the end of the Double Right Shoulder. If the time symmetry continues then the December 2014 high should equate to a high due in early November. The price symmetry between now and early November could be very choppy which is compared to the price pattern between early December 2014 to late February 2015. Our indicators now are calling for a bottom. The neck line of the Head and Shoulders top pattern comes in near 2050 range and an upside target. As we have said in the past that Head and Shoulders pattern have symmetry and we believe the symmetry will continue to play out. On the chart above we have “You are here” which is in reference to the symmetry of this pattern in a folded sheet image. The up and down waves starting in December 2014 may be playing out in a folded sheet image going forward and suggests the volatility will continue. Yesterday’s low could be tested before heading to the target near 2050 but doesn’t have to, either way the 2050 range should be seen and a possible exit point for the SPX long position.
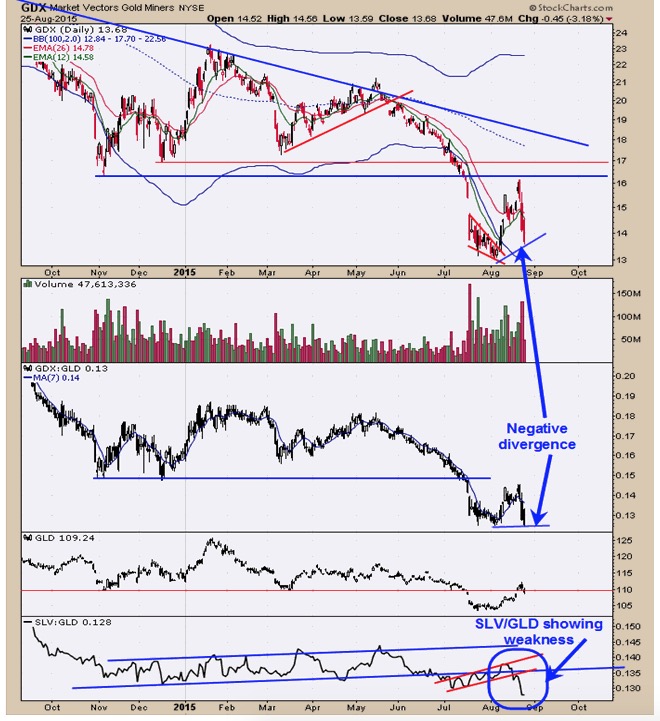
The COT (Commitment of Traders) report remains bullish for the last four weeks as the Small Speculator remains net short of last report dated 8/21/15 at -11711 contracts and Commercials remain in bullish territory of less than -50K at -29,948 contracts. The chart above is the daily GDX. The bottom window is the silver/Gold ratio in the ETF format of SLV/GLD. Normally it’s a bullish sign for gold and gold stocks when SLV is outperforming GLD and that happens when this ratio is rising. Over the last week this ratio broke to new short term lows and suggests GLD may retrace short term. The GDX/GLD ratio is matching its previous minor low where GDX is above its previous low. Normally the GDX/GLD ratio leads the way for GDX and this condition suggests that GDX decline may continue. As we have said before GDX may back fill and build a base and eventually will have a bullish outcome.
Tim Ord,
Editor
For examples in how "Ord-Volume" works, visit www.ord-oracle.com. New Book release "The Secret Science of Price and Volume" by Timothy Ord, buy on www.Amazon.com.