
How to Use Bollinger Bands with Quantity Indicators
Bollinger Bands are an outstanding indicator for analyzing sideways patterns. The bands ability to expand and contract revealing the amplitude of price is a critical factor for accurately identifying breakout action before price moves up or down. Use Bollinger Bands® topping action to determine that the sideways pattern is actually a topping pattern. However determining the direction price will take out of the breakout is determined not by Bollinger Bands, but by quantity indicators that reveal whether large and giant lots are accumulating or rotating during the sideways action.
Another key factor in identifying sideways platform Bollinger Bands® topping action is that the bands will contract during the sideways pattern, then price will hold below the center line of the bands and contract.
See the chart example below of Apple, Inc. (NASDAQ: APPL).
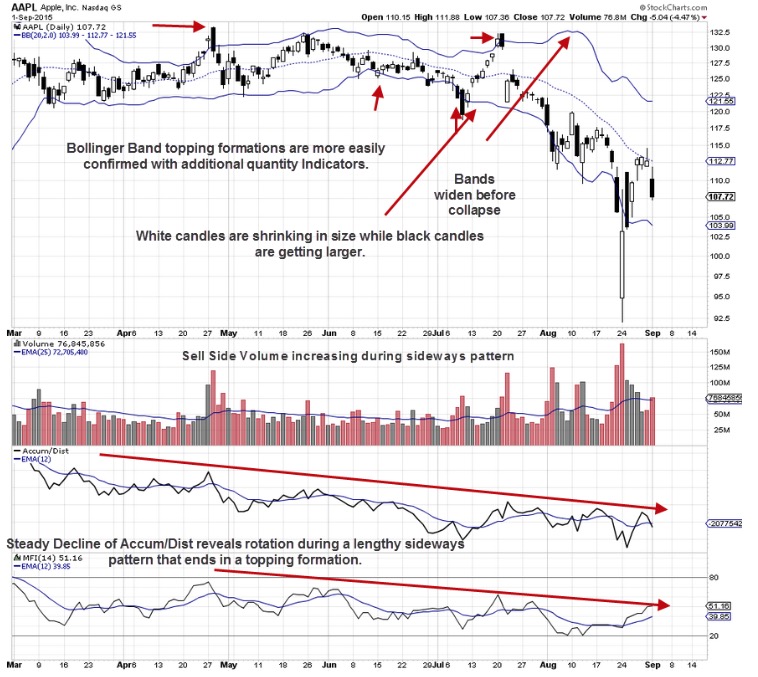
There is often a fake-out run, the final assumption by many smaller lot traders that the breakout will go to the upside. This is seen in the chart in July with tiny white candles running up with common gaps, the telltale pattern of Retail Traders trading systems. The stock is in rotation mode with giant lots selling to lower inventory. The retail run up provides the liquidity to give more impetus to the large and giant lots rotation, then there is more rotation from Time-Weighted Average Price TWAP orders triggering, and so consequently the stock gaps and runs down. Often times this can cause a loss for Retail Traders who assume the stock will break out to the upside.
Tops form differently nowadays as more and more orders are automated triggering on preset determiners such as Volume, Time, and Price. Using Bollinger Bands optimally requires being able to select indicators that work well with them. Those other indicators selected must include the data not used in Bollinger Bands analysis, namely Volume and Quantity Indicators. Since a huge contingent of professional Smaller Funds Managers use Volume-Weighted Average Price VWAP orders, Volume Indicators are now even more important for the Technical and Retail Traders to incorporate in their analysis. Without proper Volume and Quantity Indicators, Retail Traders are using only half the data necessary for the best entry and exit signals.
Summary
Determining Bollinger Bands® topping action is the first step in the analysis process, then analyze the direction price will take out of the breakout by using Quantity Indicators. Bollinger Bands are extremely versatile and can be used not just on price but also over quantity indicators, other price indicators, volume oscillators, as well as many other applications. There are far more ways to incorporate this powerful indicator into technical trading which can speed up analysis, improve risk analysis, and streamline trading processes.
Trade Wisely,
Martha Stokes CMT
www.TechniTrader.com
info@technitrader.com