
How to Know when It Is Over
Often times Technical and Retail Traders jump back into buying stocks before a Market Correction has ended. Sometimes this is a “Buy-on-the-Dip” strategy that backfires as the market opens up, then sells down the remainder of the day. Futures are no longer reliable for determining the direction the market will take for the entire day. Futures only indicate how the market will open. Once the market is open High Frequency Traders HFTs dominate the first few minutes of the day, which can quickly reverse the open or suddenly change the direction of price action.
For Technical Traders this can be frustrating if they are still depending upon Index Futures to decide whether to buy long or sell short. Frequently Technical Traders will perceive the market as being far more volatile than what actually exists. This happens when voids occur which are difficult to see unless you are using Market Condition Analysis Scans which reveal the Momentum, Bias, Market Condition and where the majority of Professionals, HFTs, and Smaller Funds are trading. Market Condition Analysis also reveals whether the Dark Pools are active either accumulating, distributing, or in a rotation mode which is moving money from one stock to another.
How to know when it is over and determining the final low of a Market Correction requires the ability to see when the Dark Pools commence buying again. During a correction the Dark Pools which are Giant Institutions, do not sell short nor do they buy stock. Instead they wait for the prices to fall down into their previous Dark Pool Buy Zones™ or within the price range at which their Quantitative Analysis has determined is a bargain for a particular stock.
The Index chart example below of the Dow Jones 30 Industrial Average (INDEX: INDU) shows no sign of Dark Pools.
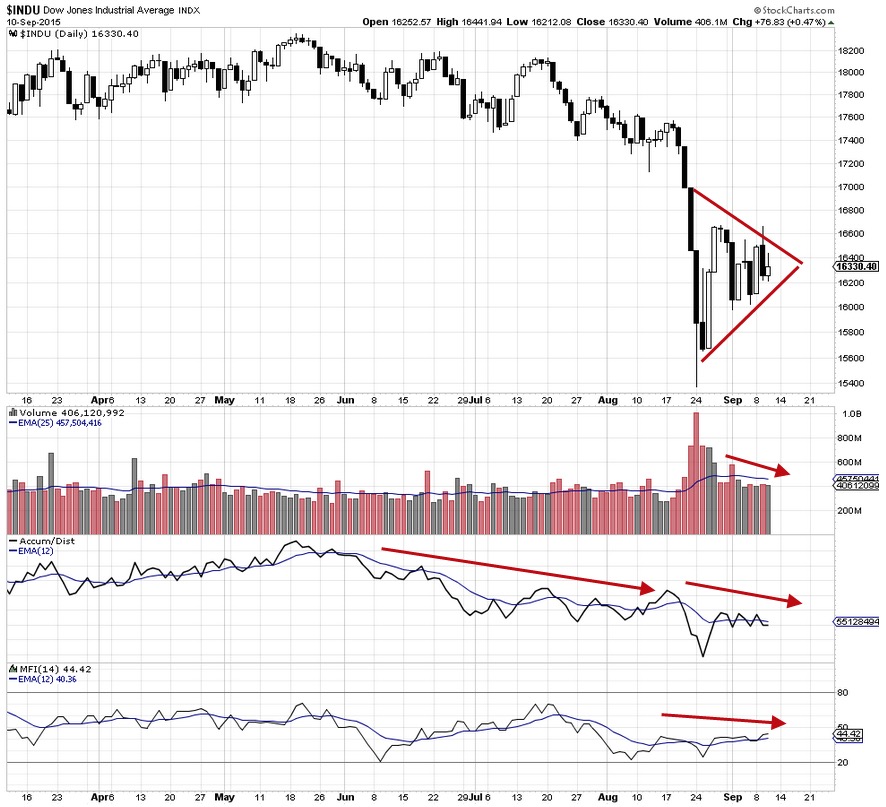
Instead the Index chart shows a Moderately Downtrending Market Condition has been underway for over 2 months, and a triangle is developing. Buyers who are mostly Volume Weighted Average Price VWAP and Independent Investors, chased the HFT action in early September. However sellers continue to control and dominate, easily turning the runs up into whipsaw and reversal runs.
There is no sign of Dark Pool giant funds buying in at this time. Even though Futures were high and ran the Index up, sellers returned before the Index could make any significant gains. Volume is well below average over the past 2 weeks, which is a common pattern when Independent Investors are “Buying-on-a-Dip” believing the downtrend Market Correction is over.
Until there are strong signals that Dark Pools are buying, more selling is likely and more HFT triggered sell offs pose a higher risk for Independent Investors “Buying-on-the-Dip.” Volume is a key indicator during a correction, as the runs up are unsustainable without higher than average Volume.
Summary
Looking back at Volume during the Trading Range Market Condition that started in January, Volume to the upside is lower throughout the range which warned early on that the Trading Range was at risk of breaking to the downside in a Market Correction. Coupled with an overall rounding shape candlestick pattern, technically the Dow 30 had only one way to conclude the Trading Range condition, which was to the downside. This was an easy technical pattern to see as long as Volume was included in the analysis.
Trade Wisely,
Martha Stokes CMT
www.TechniTrader.com
info@technitrader.com