Monitoring purposes SPX: long SPX on 8/21/15 at 1970.89.
Monitoring purposes GOLD: Flat
Long Term Trend monitor purposes: Flat

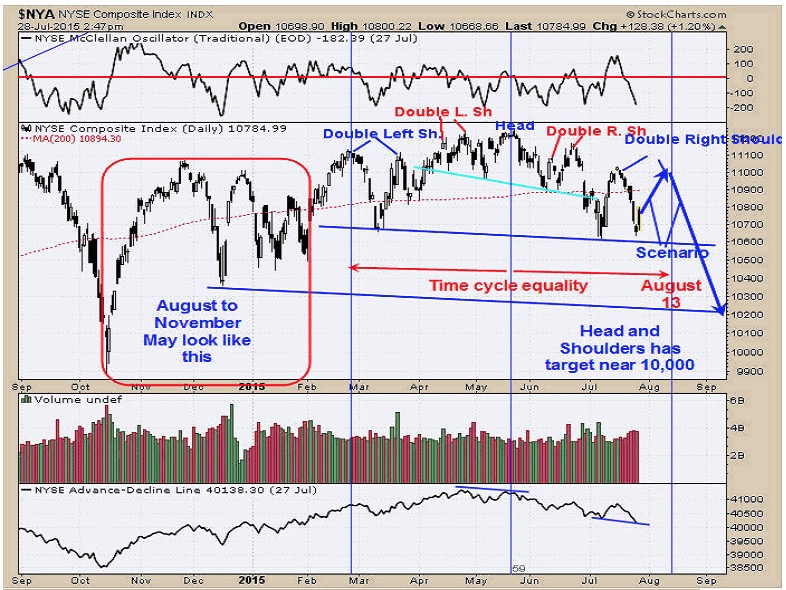
Above is the chart that was posted on the July 28 report. We said in that report, “We put a border around the time frame from Mid October 2014 to February 2015. As we have said in the past markets have symmetry and if the current symmetry continues on the NYSE, than something similar looking to October 2014 to February 2015 may appear from August 2015 to November 2015. So the volatility could continue.” That prediction appears to be playing out. Yesterday the TRIN closed 4.97 and the TICK closed -469 and that combination has lead to short term lows in the market. The “Folded page image” of mid October 2014 to February 2015 plays outs (circle in Red) than the volatility will continue into November. The commentary on page two helps to identify where we are now. long SPX on 8/21/15 at 1970.89.

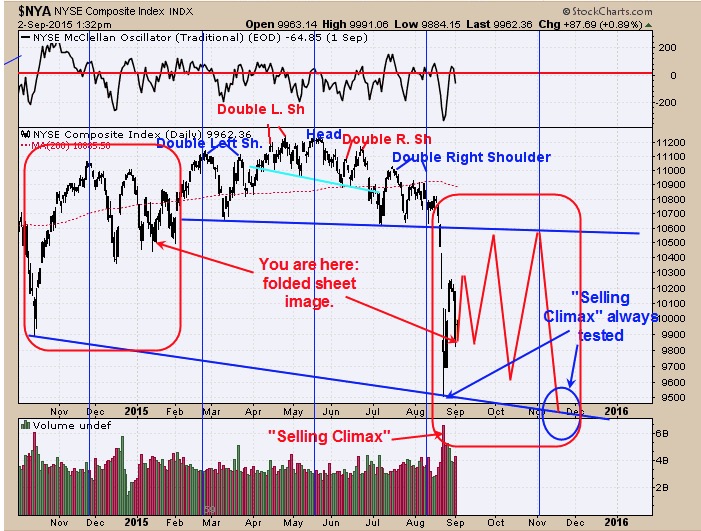
Above is the “folded page image” (circle in Red) of what may play out in the coming weeks. Yesterday’s decline produced a bullish setup on the combination of the TRIN and Tick readings and suggests a bounce over the next several days. If the “Folded page image” plays out than the current bounce may not go far and end near last weeks highs. Next week is the week before option expiration week and a week where whipsaws are common and therefore where a pull back could materialize. Last weeks high produce two +800 uptick closes in a roll and two TRIN closes less than .40 which is bullish on a larger timeframe but bearish on a short term timeframe as it suggests short term exhaustion. The current bounce may produce short term similar readings in the TRIN and Tick and gives us a heads up. We went back and did a study where the TRIN and Ticks had similar readings as we have now and the findings came up from the period of early August to early October 2011 bottom where volatility was high which is what we are expecting here. At some point (most likely in November) the “Selling Climax” of August 24 will be tested and will determine if the bull market will live or die. If there is great panic in the TRIN and Ticks on the “Selling Climax” test than bull market will live. If panic is not present on the test than that will be a bad omen.

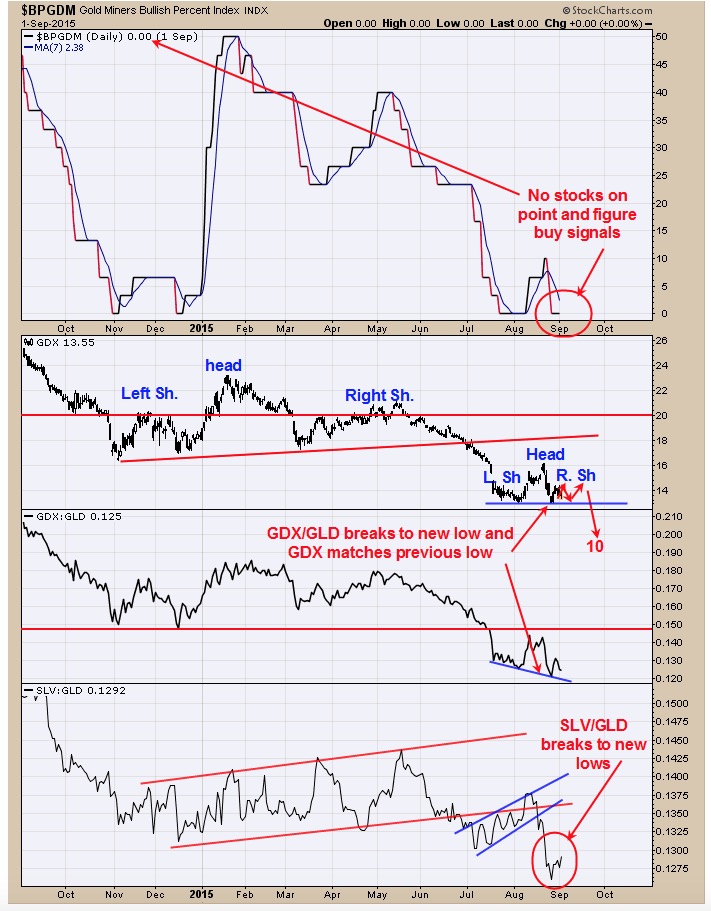
The COT (Commitment of Traders) report are back to neutral as the Small Speculator remains net short of last report dated 8/28/15 at -8097 contracts and Commercials now in neutral position with -62,636 contracts. Normally is a bullish sign for gold when the Short position for the commercials is less than 50,000 contracts. The bottom window is the ETF for silver and gold which is SLV/GLD ratio. It’s a bullish sign for gold and gold stocks when the SLV/GLD ratio is rising and as you can see here that is not and a bearish sign for the gold market. The GDX/GLD ratio broke to new lows where GDX matched its previous low. Normally GDX/GLD ratio leads the way for GDX and suggests GDX will break its previous low at some point and keeps the picture bearish. The pattern forming on GDX appears to be a bearish Head and Shoulders top pattern. This potential Head and Shoulders top pattern has a downside target near 10 on GDX. If GDX creates a sideways pattern for the next couple of weeks it will increase the odds that a head and Shoulders pattern is developing. We have a cycle turn date near 9/16 which is two weeks from today. We could end up with a sell signal than, if market trades sideway into that time frame.
Tim Ord,
Editor
For examples in how "Ord-Volume" works, visit www.ord-oracle.com.
New Book release "The Secret Science of Price and Volume" by Timothy Ord, buy on www.Amazon.com.
