
Monitoring purposes SPX: long SPX on 9/22/15 at 1942.74.
Monitoring purposes GOLD: Flat
Long Term Trend monitor purposes: Flat
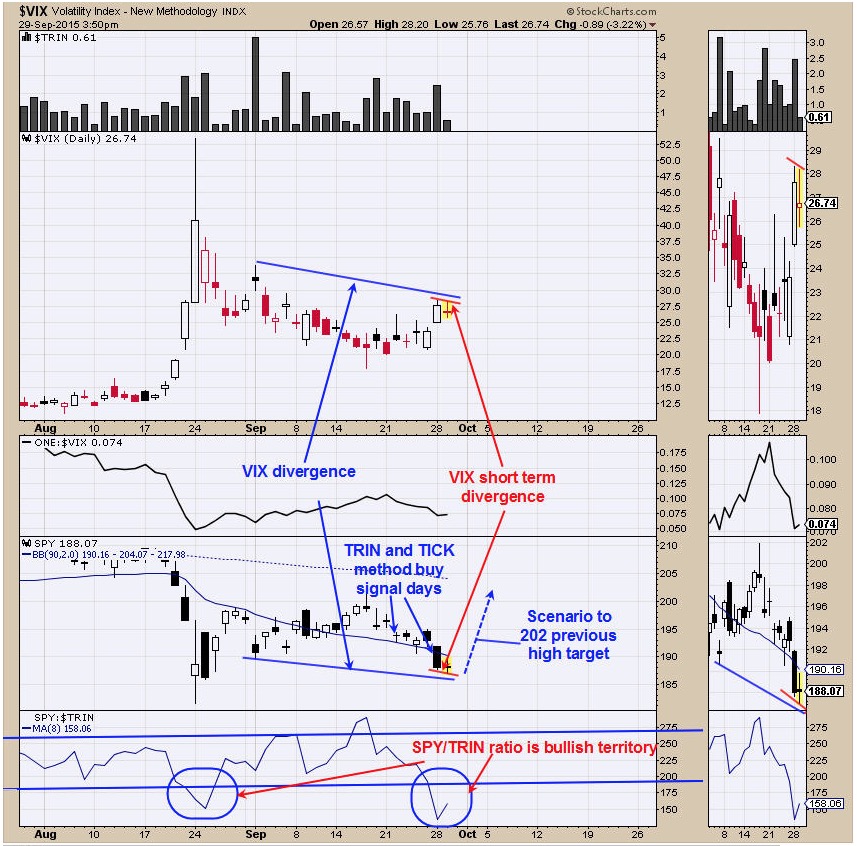
The bottom window in the above chart is the SPY/TRIN ratio which helps to gauge the panic in the TRIN compared to the price of the SPY. As you can see the TRIN in relationship to the SPY is lower now compared to the August panic bottom. The higher the panic, the stronger the bottom and the current panic suggests that there is a bottom near by. The VIX also is showing a bullish divergence here where the VIX has made a lower high and the SPY has made a lower low. Taken that thought one step further, today the SPY made a lower low compared to yesterday and the VIX made a lower high compared to yesterday and a short term positive divergence. The TRIN closed at 2.46 and the TICKS closed at -588 yesterday and suggest a bottom will form the day of the readings to as late as two days later which would be tomorrow at the latest. The September 17 high had high volume and most high volume highs are tested which comes in near 202 on the SPY and our upside target. Long on 9/22/15 SPX at 1942.74.
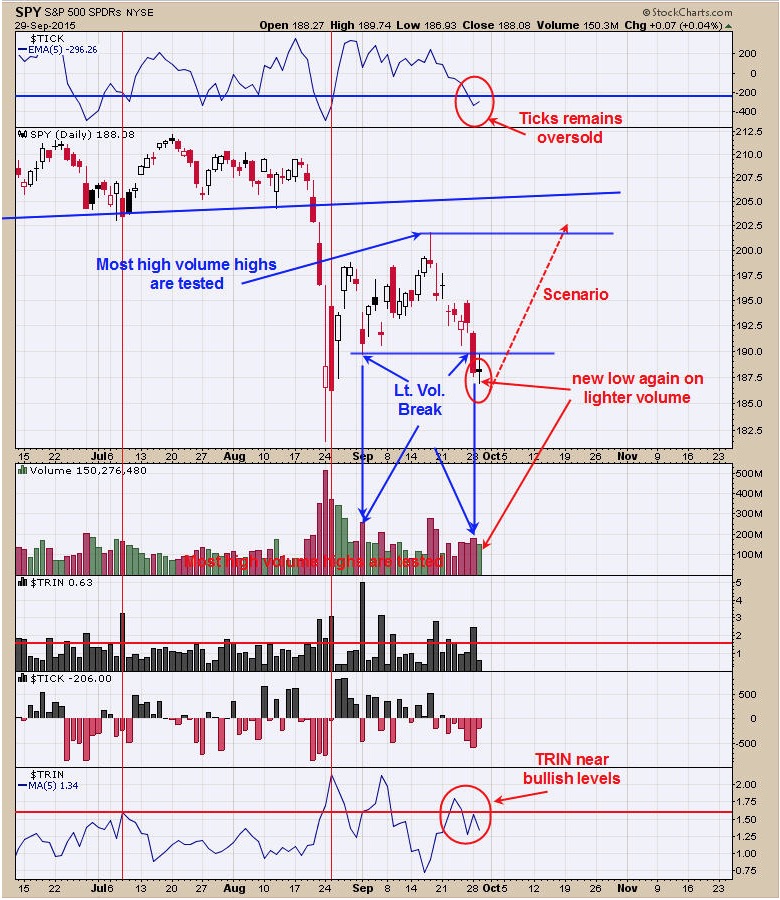
The September 17 high had high volumes and most high volume swings are tested and our upside target for now. On September 22, a bullish signal was triggered by the TRIN closing above 1.50 and the Ticks closing below minus 300. Market has pushed lower and another set of bullish readings by the TRIN and Ticks where recorded yesterday and suggests market is near a another bottom. Once the bullish parameters are reach by the TRIN and Ticks, a bottom is expected to form the day of the readings to as late as two days later, which would be tomorrow. The 5 day average of the TRIN (bottom window) remains near bullish territory and the 5 day average of the TICK (top window) is in bullish territory. Yesterday’s break below the September 1 low occurred on much lighter volume and suggests a false break to the downside and a bullish development. Today’s trading hit a new short term low and than closed above yesterday’s close on lighter volume and suggests the downside push is exhausted. Long SPX on the close of 9/22/15 at 1942.74. For free 30 day trial, send notice to tim@ord-oracle.com.
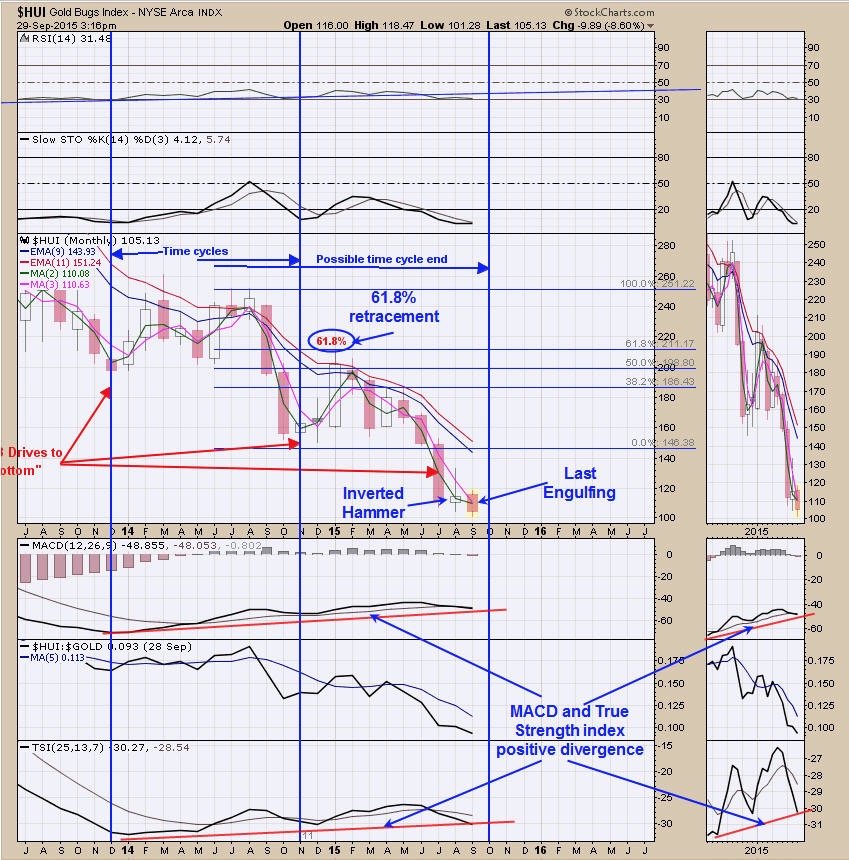
The COT (Commitment of Traders) report are neutral as the Small Speculator remains net short of last report dated 9/25/15 at -3,897 contracts (near split in half from previous week) and Commercials are back to a neutral position with -57,228 contracts (below 50,000 contract is a bullish sign). We showed this chart yesterday and is updated to today’s trading. We said, “The chart above is the monthly HUI chart going back to 1984. The monthly pattern that appears to be forming on the HUI is a “Three Drives to Bottom” pattern and the Third Drive down appears to be forming now. The key to a “Three Drives to Bottom” is that the rally off of the Second bottom needs to retrace at least 61.8% of the previous decline, which the example above has done. There are bullish candlestick pattern forming on the monthly charts. Last month a bullish “Inverted Hammer” and this month so far a bullish “Last Engulfing” is forming but another two days (one day now) to go to month end before that pattern can be confirmed.” There is a cycle due in October which could be important for a turn high. The bottom window is the True Strength index and the third window up from the bottom is the monthly MACD and both are showing a positive divergence. With two bullish candlestick patterns formed over the last two month and momentum to the downside near “0” a reversal may not be far off. Still neutral for now.
Tim Ord
Editor
For examples in how "Ord-Volume" works, visit www.ord-oracle.com. New Book release "The Secret Science of Price and Volume" by Timothy Ord, buy on www.Amazon.com.