
Monitoring purposes SPX: long SPX on 8/21/15 at 1970.89.
Monitoring purposes GOLD: Flat
Long Term Trend monitor purposes: Flat
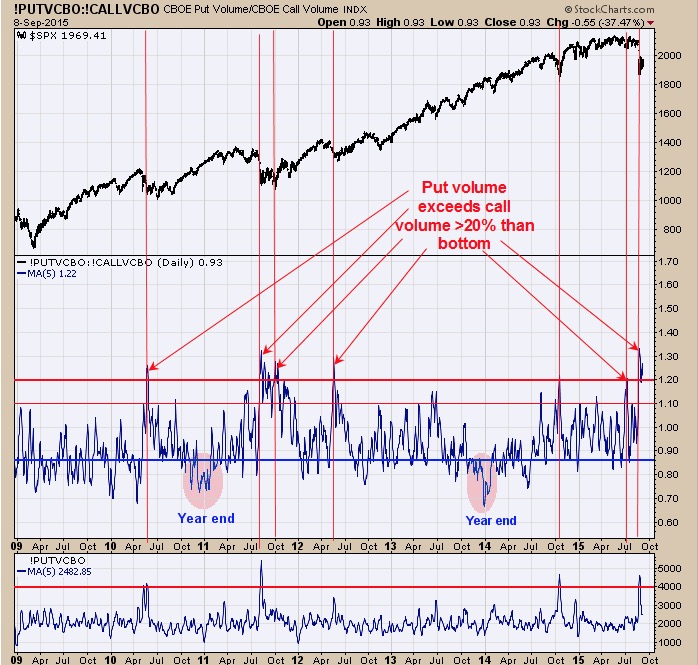
Friday’s short term report, noted that there was a possibility that the September 1 low may be tested. Turns out the market roared higher today without the test. Above is a simple tool that doesn’t get triggered much which is the put volume compared to call volume on the CBOE. When put volume exceeds call volume by 20% or more than that has stood the test of time that a climatic low in the market has formed. The chart above goes back 7 years and shows the times when the put volume exceeded call volume by at least 20% and all have lead to bottoms with some leading to bigger bottoms than others. A side note. Today’s TRIN closed at .38 and exuberant and another TRIN close less than .50 tomorrow could lead to a pull back for short term. Lets we what tomorrows brings. long SPX on 8/21/15 at 1970.89.
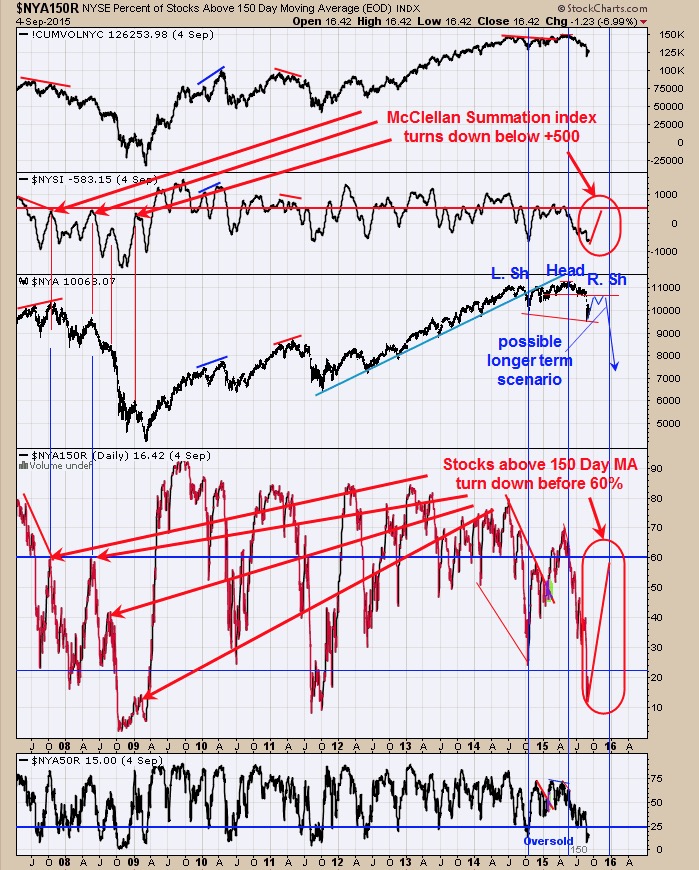
Above is a possible longer term scenario. The pattern forming on the NYA appears to be a Head and Shoulders top. The Right Shoulder formation could be starting now and may take another month or more to complete. The top of the Right Shoulder could find resistance near the 10,650 range on the NYA (205 range on the SPY). Since the Left Shoulder had a double hump in that range than the Right Shoulder may also to keep the symmetry. Form there completing another “Head and Shoulders” top the market may start another decline with a measured target to 7,700 on the NYA. The bottom window is the Stocks above 50 day moving average and when it drops below 25% the market is considered oversold and due for a bounce. The strength of the next rally will determine of what to expect next. The second window down from the top is the NYSE McClellan Summation index. If the Summation index turns down before reaching above +500 on the next rally than that could spell trouble for the market. Add to that, if the NYA stocks above 150 day moving average fail to get above 60% than those conditions would suggests the Head and Shoulders top with a measured downside target to 7,700 on the NYA is a real possibility.
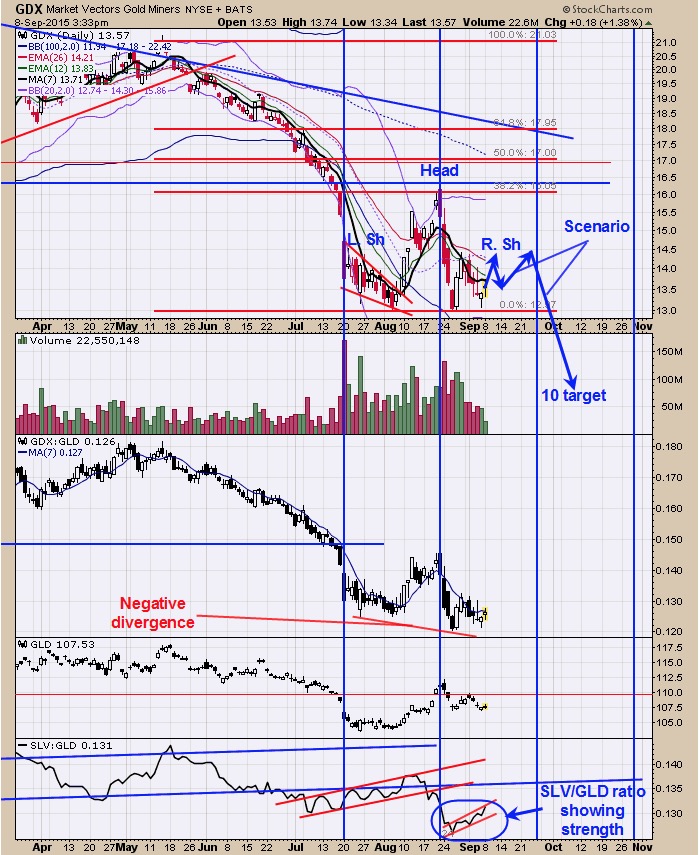
The COT (Commitment of Traders) report are back to neutral as the Small Speculator remains net short of last report dated 9/4/15 at -3597 contracts and Commercials now in neutral position with -69,088 contracts. Normally is a bullish sign for gold when the Short position for the commercials is less than 50,000 contracts. The bottom window is the ETF for silver and gold which is SLV/GLD ratio. It’s a bullish sign for gold and gold stocks when the SLV/GLD ratio is rising. Since August 27 this ratio has been rising and suggests GDX will trades at least sideways if not move higher short term. The GDX/GLD ratio broke to new lows where GDX matched its previous low. Normally GDX/GLD ratio leads the way for GDX and suggests GDX will break its previous low at some point and keeps the bigger picture bearish. The pattern forming on GDX appears to be a bearish Head and Shoulders top pattern. This potential Head and Shoulders top pattern has a downside target near 10 on GDX. If GDX creates a sideways pattern for the next couple of weeks it will increase the odds that a Head and Shoulders pattern is developing as the Right Shoulder will be symmetric in time with the Left Shoulder (defined by the vertical blue lines). Also notice that the late August rally took GDX to a weak 38.2% retracement of the previous decline and another bearish sign. We have a cycle turn date near 9/16. We could end up with a sell signal than, if market trades sideway to up into that time frame.
Tim Ord,
Editor
For examples in how "Ord-Volume" works, visit www.ord-oracle.com.
New Book release "The Secret Science of Price and Volume" by Timothy Ord, buy on www.Amazon.com.