
Using %B with MFI Indicator
Many traders use Bollinger Bands to help them find compression patterns for momentum breakout trading strategies. Bollinger Bands are one of the most reliable and flexible channel indicators for Momentum Trading. Few traders use %B the oscillator version of Bollinger Bands, which when combined with a Quantity based indicator can provide meaningful analysis that is harder to see with Candlesticks or pure Volume interpretations.
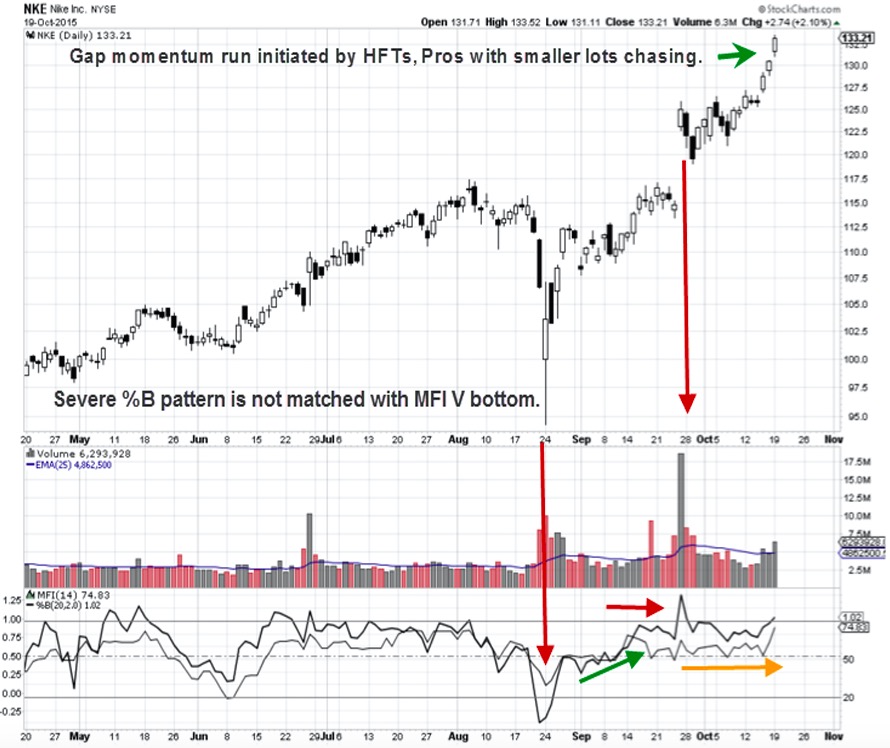
On the chart below for Nike, Inc. (NYSE: NKE) is %B laid behind the Money Flow Index indicator in the bottom chart window.
By using %B with MFI Indicator which are both primary indicators instead of using a subordinate indicator such as a Moving Average, a totally different approach to analyzing Price and Quantity activity is presented.
This is a different way of studying and comparing what is going on between Price and Quantity over time. Therefore instead of just relying on Price action, this combination indicator provides the missing element of Volume aka Quantity.
Whenever a Trader uses all 3 pieces of data within an indicator analysis it improves the interpretation, ease of use, and speed of the analytics.
NKE has an interesting pattern. On August 24, 2015 the entire market suffered a major one day drop and %B shows this drop to be extreme, however at the same time MFI did not match in magnitude. It is far shallower a V formation indicating clearly that the Quantity of selling did not match the amount that Price moved down. This is a Contrarian Pattern which gives Traders insight that is not available by just using Price.
Using %B with MFI Indicator reveals they came into harmony or sync in early September, and then diverged in the middle of that month. The %B rose faster than MFI, and spiked to the top of the indicator chart as price gapped on extra ordinary Volume. This is indicative of High Frequency Trading HFT action. Then %B continued to stay well ahead of MFI which remained lower hugging its center line along with Price and Volume, until the last three days when it rose.
List of how to interpret these indicators:
1. The Volume activity after the HFT gap was Smaller Lot Investors and Smaller Funds rushing to buy in, after the huge Volume day created by HFTs.
2. Traders who understand this pattern can plan and prepare for an Entry day resting pattern, which occurred on October 13th and 14th prior to the 3 day Runaway Gap sequence.
3. Currently the candlestick pattern warns of an extreme Angle of Ascent™ and an Exit strategy needs to be used to avoid losing profits.
Understanding who is buying at any given time helps Traders plan and prepare for sudden surges of Price momentum runs. Smaller Lots tend to move price in speculative runs. This one was also driven by Pro Traders as well, who entered well ahead of the three day Runaway Gap momentum run.
Summary
Using %B with MFI Indicator or another Quantity indicator can be a useful edition to your indicator tool set. Learning to read %B doesn’t take a lot of time, and it can reveal patterns that are harder to see than in pure Price. It is an excellent indicator for Beginners as well as expert Technical Traders.
Trade Wisely,
Martha Stokes CMT
www.TechniTrader.com
info@technitrader.com