
Detrending Price Oscillator Indicator for Bottoming Patterns
One of the crucial requirements for swing and day traders is the ability to identify the commencement of a bottom in a stock chart candlestick pattern. This offers two huge advantages to the technical trader.
1. The ability to avoid selling short as the bottom starts often with huge velocity runs and big rebound action.
2. The opportunity to trade the upside velocity that often accompanies a sudden reversal of trend pattern.
The problems for most Technical Traders are how to identify Stock Bottoming Formations earlier, and how to identify a true bottom low from simply an oversold condition on a continuing Downtrend and Market Correction phase.
Price and Time Indicators are good for oversold conditions but do not define sufficiently any pattern to confirm when it is a final low. This leaves Technical Traders hesitating to act rather than having a decisive plan to either continue Selling Short, or switch back to Swing style Velocity and Momentum Trading to reap the rewards of early identification of an extreme low pattern. Price and Time Indicators, Price Oscillators, and Momentum Price Indicators can show overbought patterns but rarely provide that true extreme pattern prior to a major Velocity run reversal.
This is particularly true nowadays since the bulk of the orders are no longer done through the major exchanges but are executed on Alternative Trading Systems ATS, Electronic Communication Networks ECNs, and other off-exchange trading venues. With so little trading going on in the major exchanges, the Stock Market has become similar to the Commodities Exchanges where the pit activity is minimal and the electronic automated market carries the bulk of the activity.
Technical Traders who rely only on Price and Time Indicators are at a decided disadvantage in how to identify Stock Bottoming Formations earlier. However incorporating a few easy to use additional indicators and thereby determining when an extreme activity has occurred which usually precedes the final low, can make all the difference in profitability as stocks trend down into bottoming areas.
The Detrending Price Oscillator DPO, Money Flow Indicator MFI, Accum/Dist Indicator along with Volume are important indicators to include in your analysis. The DPO indicator is used ideally for extreme cycle deviations, see the chart example below.
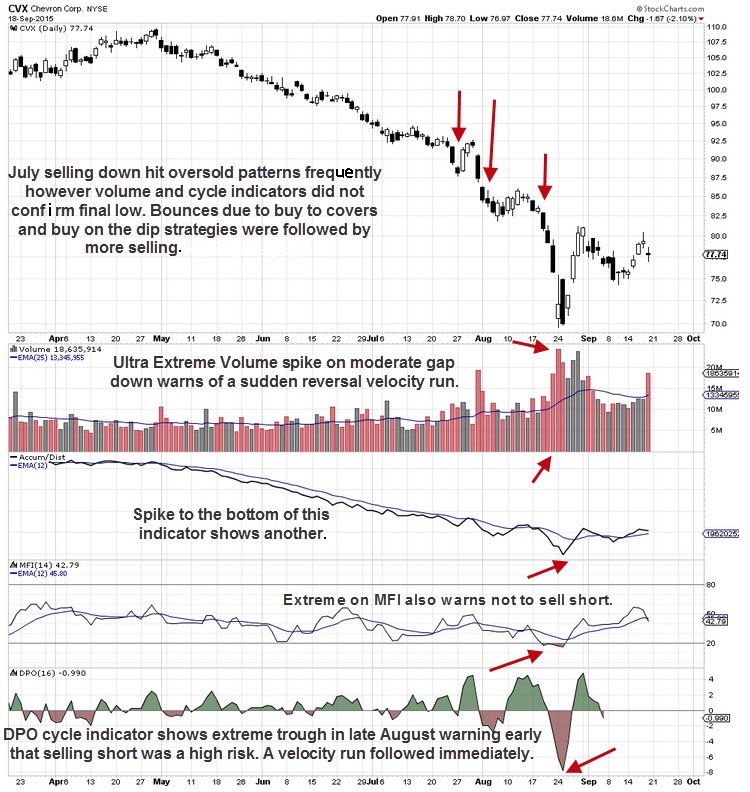
In this chart example the DPO has formed an extreme trough deviation on extremely high Volume, a spike on the Accum/Dist to the bottom of the chart, and an extreme MFI spike to exceed the low of the chart.
All four indicators are showing that the selling in August was well beyond the normal ranges of overbought. The stock had overbought price action in July, however it continued to move down further as the Volume indicators did not confirm and extreme condition. DPO was not extreme, and Volume was above average but not extreme.
Summary
With 9 Market Participant Groups how to identify Stock Bottoming Formations earlier as well as bottoming action, can be hard to see unless additional indicators beyond overbought oscillators are used. Use these additional indicators to confirm the extreme conditions, which precede most velocity runs that commence a bottoming phase.
Trade Wisely,
Martha Stokes CMT
www.TechniTrader.com info@technitrader.com