
Volume Bars Analysis
It used to be that price was the most important indicator on a stock chart. Most stock indicators, market breadth indicators, and sector indicators are based solely on price and time due to the importance weighted on price action in the past. Most stock indicators writers of the
20th century focused on writing Price and Time Indicators, to reveal patterns not easily seen in price charts of that era.
Candlestick charts have grown exponentially in popularity and are far easier to read and interpret. However not including the 3rd data of the entire data set that is derived from each trade order transaction, increases risk factors in the automated marketplace.
The reason Volume and Quantity Indicators have become such a critical aspect of chart analysis, is the new order types available exclusively to the giant and large institutions that use Dark Pools aka Alternative Trading System ATS venues for their giant and large lot transactions. The goal of a giant institution is to buy or sell the stock at a predetermined price range, but no higher and no lower. This is done using a precise entry trigger mechanism that insures a mid-range National Best Bid Offer NBBO execution.
The result is giant and large lots trading out of sight off the exchanges, are able to buy or sell stocks without disturbing price. These institutions control a massive amount of shares of stock, and account for the bulk of giant and large lot transactions.
By studying Volume Bars and Candlesticks as well as Price and Time Indicators such as MACD and Stochastic or whatever Price and Time Indicator a trader prefers, they can improve their success rate rapidly and significantly.
One analysis that price is unable to provide in the new Market Structure where the giant lots do not disturb price and High Frequency Traders HFTs are unable to front run these giant lot orders, is Volume patterns.
Volume Bars declining as price moves up is indicative of smaller lot buying speculatively, as seen the past several days in the chart example below for Home Depot, Inc. (NYSE: HD).
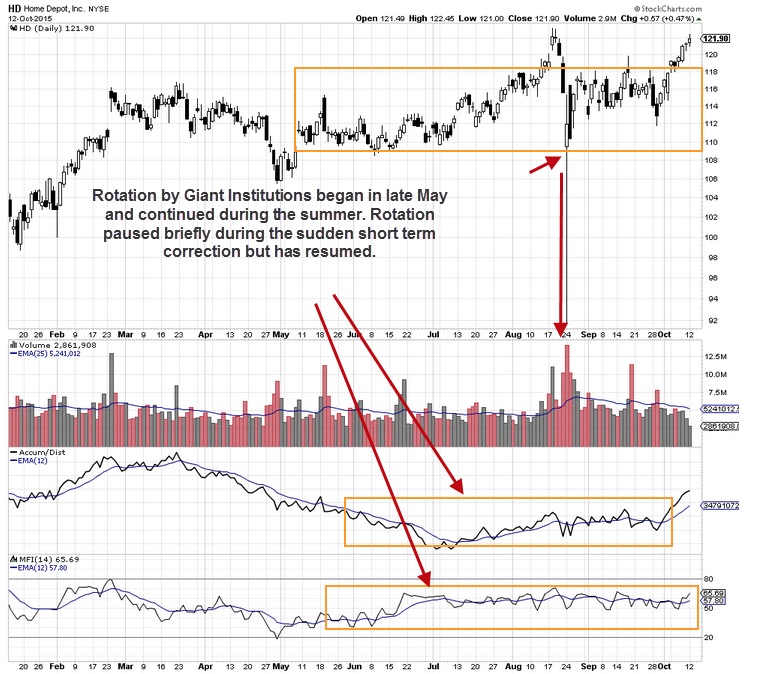
Another area to monitor is the Dark Pool Quiet Rotation™ pattern. They usually show up in sideways action either in a Bottom, Topping Formation, or Platform development. During the sideways action the Dark Pools strategically establish trigger order price levels, allowing price to move as it normally would without their interference.
As you can see in the chart window for the Accum/Dist indicator, there has been a Rotation pattern during the summer months even while price holds and runs up. Then HFTs drive price down on the Chinese Market implosion in late August, for a one day anomaly candle pattern indicated by the short red arrow. The Dark Pools trading ceases immediately on that day but resumes the following week, and into current price action. Meanwhile smaller lots, who are mostly Independent Investors and Retail Traders are buying HD on a “dip.”
Summary
Although Rotation will not immediately create a Downtrend, over time the weighting of selling large lots will begin to overwhelm the smaller lot buyers. The Volume Bars in this chart weaken and lessen as the stock moves up to retest the prior highs. This is a negative divergence of Volume and Quantity away from price.
Trade Wisely,
Martha Stokes CMT
www.TechniTrader.com
info@technitrader.com