
We have learned a lot about the behavior of the McClellan A-D Oscillator since my parents, Sherman and Marian McClellan, brought it to the public back in 1969. One of the points that we have learned is that the proper way to interpret it depends on the market environment you are in at any given moment.
If I were to distill all of the collected wisdom about the McClellan Oscillator into simple sound bites, I would have to break it down according to levels of understanding of the complex messages it can convey. So here, in degrees of increasing sophistication, are the important points:
McClellan Oscillator 101 – Positive is good, negative is bad.
McClellan Oscillator 201 – Overbought and oversold readings are important, as are divergences, although they can sometimes be misleading.
McClellan Oscillator 301 – Complex structures above or below zero convey an important message about which side, bulls or bears, is in control. Conversely, simple across-and-back structures imply a lack of control.
Graduate Level – How one should interpret the McClellan Oscillator is dependent on whether the stock market is in an uptrend or a downtrend.
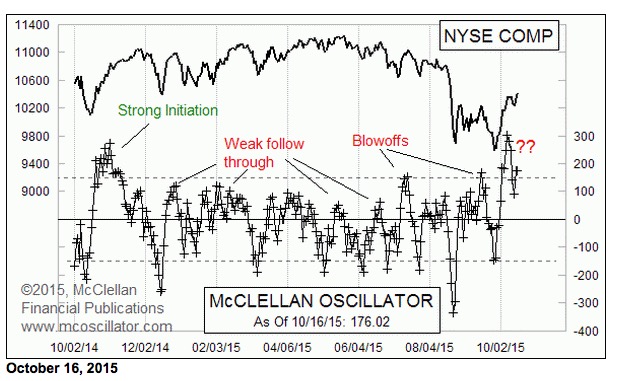
Now some explanation, as I try to bring you all up to the graduate level in one fell swoop. When the stock market is in an uptrend, if you see the McClellan A-D Oscillator rise up to a level above +150, and the higher the better, it is a sign of strong upward initiation and a promise of even higher highs to follow. Yes, it is an overbought condition, but an overbought reading in an uptrend is not a terminal event as one is in a downtrend.
We saw an example of that back in October 2014, at the left end of the chart above, when the Oscillator climbed up to a high of +271, and stayed at a high level for a long time. It was a message that the worries over the Ebola Panic were done, and that there was still plenty of liquidity available to help lift the overall stock market.
Subsequent rallies were not quite as strong, and we did not see any subsequent instances of strongly positive Oscillator readings. The final price high in May 2015 came with the McClellan A-D Oscillator at a peak reading of only +51, showing the tepid strength in the liquidity stream.
Now we are in a downtrend, and the countertrend rallies have been able to take the Oscillator up to a level which would otherwise be an indication of strong new upward initiation. But the lack of follow through reveals those high readings to be markers of blowoff tops instead of strong new initiation. The latest Oscillator peak rose all the way up to +303, and we thus far are not seeing follow-through.
If the Oscillator continues falling and goes back down through the zero line without building any complexity up above zero, then that will be a “tell” that the recent bounce has been just a countertrend rally, and is not the start of a new uptrend. That is the outcome which I expect to see, and so the Oscillator serves as a great tool for confirmation of expectations.
As an historical example of this principle, this next chart looks back at the period from 2008 to 2009.
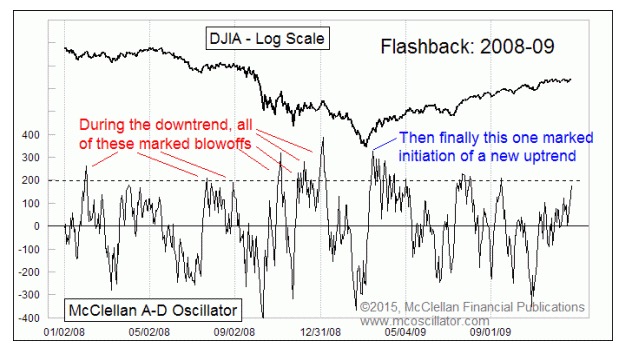
During the whole of the bear market in 2008, we saw several instances of the McClellan A-D Oscillator rising up to very high levels, not just above +150 but up well above +200. And in each case, it marked the end of a countertrend rally rather than the initiation of a new uptrend. It was not until we got past the final bottom in March 2009 that the meaning of the very high Oscillator readings started to change. Each subsequent instance of a very high Oscillator reading marked another bullish wave of upward initiation.
If one had been looking at these readings in real time, it might have been hard to know that the really high readings in late March 2009 were somehow different than the ones all during 2008. So if one had only the McClellan Oscillator as a tool, then it would have been possible to make an initial misinterpretation of the surge higher in March 2009, thinking that it was just another countertrend rally. But the tell in that case was that the Oscillator remained at a high level longer than in all of the countertrend rallies of 2008, and the market refused to stop going up. At some point an honest analyst would have to change his view and accept that there had been a sea-change.
That’s easy for me to say now, and it would have been hard to do in real time as it was happening back then, I know. But this serves as a good lesson for us all to remember as we seek to properly interpret what we see in the Oscillator and in the market going forward from here.
By that, I mean that if the +303 McClellan Oscillator reading on Oct. 8 is followed by a prompt downturn and no further upward movement, it will be a tell that we have just seen yet another countertrend rally within what is supposed to be a downtrend lasting until at least April 2016. But if, instead, the Oscillator stays above zero long enough to push the Ratio Adjusted Summation Index above +500, then that will be an entirely different message.
If you want to learn more about the McClellan Oscillator and how to interpret it, start with our Learning Center articles which are free for everyone. Then consider ordering our Advanced Topics Seminar video, which features lessons on how to interpret the McClellan Oscillator plus a whole lot more. And if you would like to order a new eBook-format copy of Sherman and Marian McClellan’s original 1970 book, Patterns For Profit, visit our Books and DVDs page.
Tom McClellan
The McClellan Market Report
www.mcoscillator.com