
Analyzing Downtrend Price Action
During a Downtrend price does not just go down, instead it often has brief periods where it moves up. Determining whether it is just a Bounce, Rebound, or if it is a true Reversal requires Spatial Pattern Recognition Skills to read the chart properly.
Everyone learns the basics of candlesticks as this is currently the most popular chart style to use. However, just learning the Japanese continuation or reversal patterns is where a Technical Trader starts. If a Trader wants to become a proficient Semi-Professional or Professional income earning Trader, then they must learn more than just these basics.
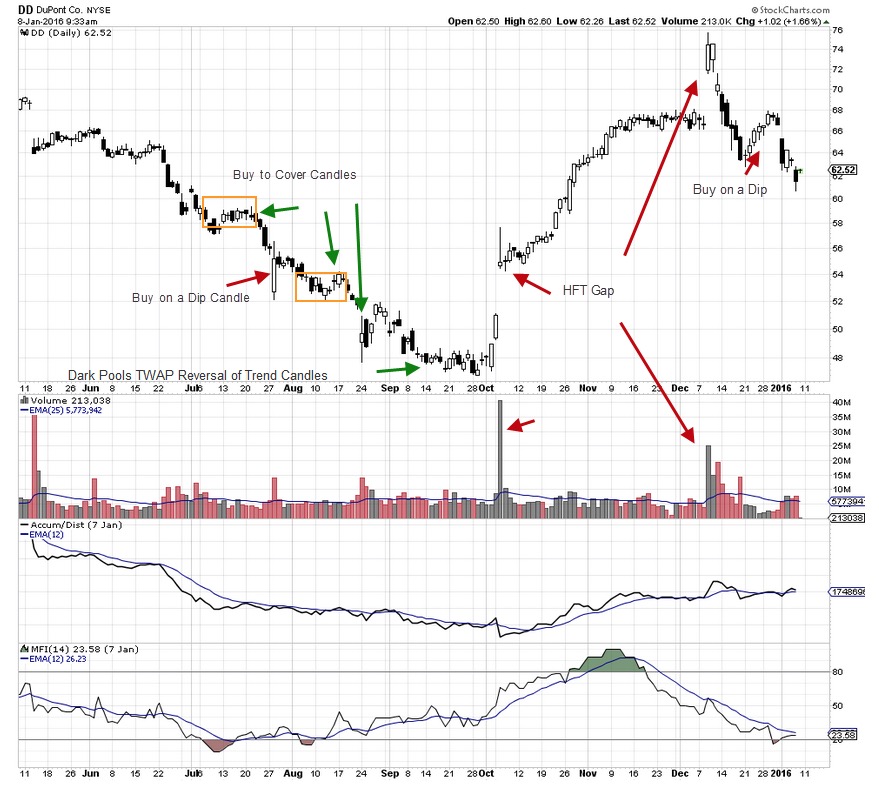
The chart example of DuPont Co. (NYSE: DD) below shows the different candle patterns of Bounces, Rebounds, and Reversals.
How to Identify Candle Pattern Bounces, Rebounds, or Reversals requires recognizing the three types of upside price action in a Downtrend. Each type is different for several reasons which include the following:
1. Which Market Participant Groups are in control of price at the time:
a. Professional Traders who sell short
b. Retail Investors or Retail Traders typically using guru recommendations
c. High Frequency Trading Firms HFTs are trading to move price
d. Dark Pools aka the giant Buy Side Institutions are long term Investors, buying on behalf of their Mutual Fund Holders
2. Whether the candle pattern is a:
a. Buy to Cover order
b. Buy-on-the-Dip order
c. Time Weighted Average Price TWAP Buy Order
3. The intent of the buy order:
a. To close a Sell Short position
b. To purchase stock at a perceived area, where the stock will continue moving up
c. To incrementally purchase a very large quantity of shares over an extended period of time
Once you recognize the above specifics then how to Identify Candle Pattern Bounces, Rebounds, or Reversals becomes self-evident. This is because as each Market Participant Group controls price, they form a distinctly different candlestick pattern on the chart based on their intent of the trade.
Professional Traders that have placed Sell Short and Buy to Cover orders create Bounce candlesticks. These candles form usually at support levels, and are small with moderate Volume.
There are Retail Investors and Retail Traders lacking sufficient stock market education, and depend upon others for their decisions. Often Retail Brokers or gurus who would benefit, encourage Buy-on-the-Dip at non-technical levels. These candlesticks tend to be longer which are an anomaly in the technical pattern, and can gap or run with very low Volume. They are Rebound candlesticks, and can move up seeming to be a Reversal aka Rally but in fact only give the illusion of it. They then fail at weak support levels as Professional Traders and HFTs step back in, to sell short again ahead of negative news.
High Frequency Trading HFT is all fully automated. There is no human controlling what is bought or sold. Usually their action occurs in the first few minutes of the day. If HFTs fill queues ahead of market open with order over flow, then the computers that make the market these days will gap up the stock. These are also Rebound candlestick patterns.
Dark Pools aka the giant Buy Side Institutions use Time Weighted Average Price TWAP orders to control price, and not disturb the trend early on in their accumulation mode. Their candlesticks are small, tightly formed, and sideways. They develop the chart bottoms and start the true rallies once their accumulation leaks out to other Market Participant Groups, mostly Smaller Funds who chase Dark Pool activity.
Trade Wisely,
Martha Stokes CMT
www.TechniTrader.com
info@technitrader.com