
How to Determine when a Velocity Downtrend is Reversing
Technical and Retail Traders need to be able to identify Reversal Patterns during a downtrend in order to avoid huge losses on selling short trades, and to be prepared and ready for early entry in the reversal of the trend. When a downtrend concludes with a V exhaustion pattern the extreme selling reverses suddenly, as stocks drop into the Buy Side Institutions Dark Pool Buy Zones™ where Time Weighted Average Price TWAP orders trigger automatically reversing the trend suddenly, even midday.
Many times Technical and Retail Traders are either waiting out the downtrend as they do not Sell Short, or are Selling Short without adequately preparing for the inevitable end of the downtrend.
The faster a stock falls and the steeper the Angle of Descent™ then the faster it will rise, once it enters a Dark Pool Buy Zone.
Candlestick Reversal Patterns include Hurdles, Pole Vaults, Engulfing Whites, Springboards, Reversal Upside, and the Sandwich are a few of the most common and most reliable candle patterns that form in the automated stock market today.
Reversal Indicators include Volume above average, Volume Surge caused by Professional Traders not High Frequency Traders HFTs, Volume Downside Exhaustion Pattern, Dark Pool Shift of Sentiment™, Volume Oscillation Extreme Downside Spike, and Extreme Flow of Funds. These patterns are some of the most common and most reliable confirmation reversal indicator patterns that form today due to the automation of the market, variety of venues, and plethora of professional order types that are not available to Retail Traders.
The combination of reversal candle patterns with reversal indicator patterns as confirmation, provides the optimal reversal analysis.
The chart example below of EOG Resources, Inc (EOG: NYSE) recently had a strong reversal candle and indicator confirmation pattern. It has moved approximately 5 points since the reversal pattern formed.
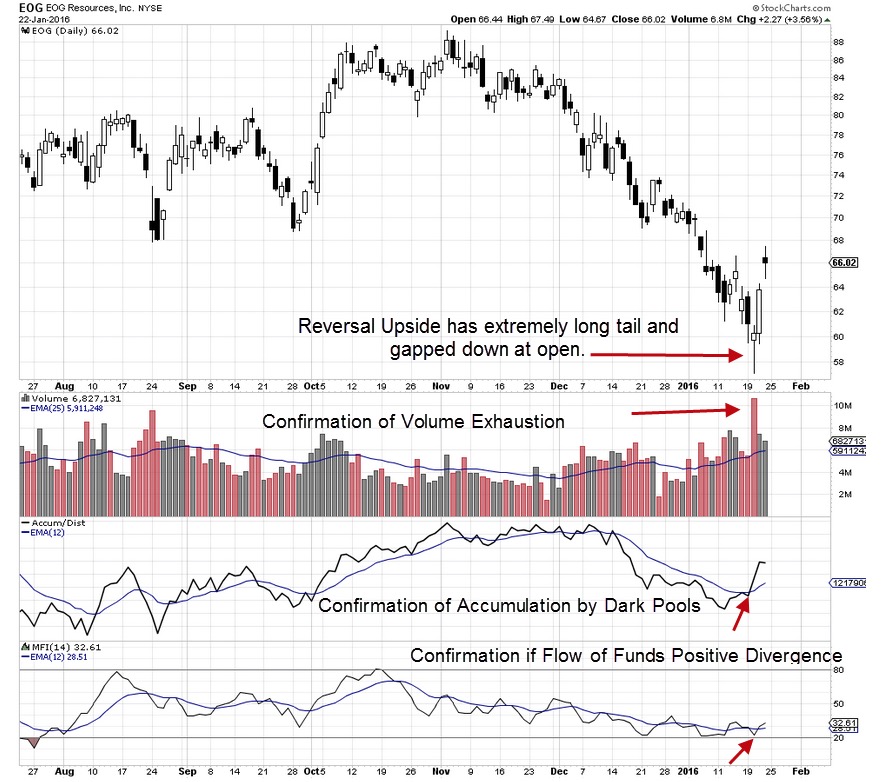
In this chart example the candletick as indicated by the red arrow, is a Reversal Upside entry signal which requires:
1. Tail or “lower shadow” must be 3 times the length of the body of the candlestick.
2. A gap down on the day that the Reversal Upside formed.
3. Confirming indicators that this is a true reversal and not a Bounce or Buy to Cover.
Confirming indicators for this chart example are the following, with red arrows in the chartwindows showing the confirmation:
1. Volume Exhaustion Pattern to the downside, which is the red bar spiking to the top of the volume indicator chart wndow.
2. Crossover of Accum/Dist indicator in the middle chart window.
3. Money Flow Index MFI indicator in the bottom chart window with a Positive Divergence.
Identifying true reversal signals early provides lower risk entries with higher points gain, as most velocity exhaustion patterns reverse with stronger upside velocity action. Often HFTs will also trigger, moving price up further or causing a gap up.
Summary
Reversal Patterns for the modern automated stock and options markets are different than the reversal patterns of just a few years ago. This is due to the plethora of trading venues and order types available to the professional side of the market and the institutions.
Trade Wisely,
Martha Stokes CMT
www.TechniTrader.com
info@technitrader.com