
Profits During Volatile Market Conditions
Volatility is a price action that often frustrates the Technical Trader. The markets appear “directionless,” “unpredictable,” or just plain confusing. Technical Traders often wonder whether they should be buying long or Selling Short. They often become disillusioned with popular strategies, or popular indicators that do not “seem to work.” Losses become either constant or chronic, and confidence in their trading abilities erodes even faster than their capital base resources. Technical Traders often complain that Volatility is a huge problem for them.
The problem is not Volatility or Volatile Price Action.
The problem is not knowing how to trade Volatile Market Conditions. When a Trader knows and understands what causes so called “volatility,” they can take advantage of the huge momentum and velocity runs that seem to appear out of nowhere. These runs suddenly move stocks up or down, with gigantic point gains or point losses.
The key to trading Volatile Market Conditions successfully is to understand why the markets are volatile at that time, at that juncture in the chart patterns. When traders know why volatility is occurring they will be able to select the correct side of the trade to engage and act on, and earn much higher profits than in normal slower Trending Market Conditions.
Here is the list of steps for learning and understanding volatility:
- The first step is to understand the “why” of volatility. It is not unpredictable, in fact it is very obvious once a Trader realizes what is going on. Volatility occurs when 2 major Market Participant Groups collide, one big market group selling while the other is buying. This creates the explosive volatile day to day and intraday action that Traders call volatility.
- The second step is to learn that volatility occurs primarily in one of two places in a Trend, either as stocks start to bottom after a lengthy Downtrend, OR as stocks start to top after a period of Uptrend to speculative buying frenzy. Bottoms and Tops are where 90% of all volatility occurs.
- The third step is to recognize the Market Participant Groups that create volatility. In Topping Formations there is Quiet Rotation™ by the giant Buy Side Institutions who are selling. There is also the buying frenzy speculative mood of the Smaller Funds and the entire retail crowd, which is a huge group of investors and traders. The simultaneous combination of activity for these two groups creates the volatile action of a Topping Formation, and it is just the opposite of activity for each group for the Downside. At that time giant Buy Side Institutions are buying, while capitulation selling by the Retail crowd and the Smaller Funds is accelerating the downside action.
The chart example for The Travelers Cos., Inc. (TRV: NYSE) below shows a volatile price action since late December 2015.
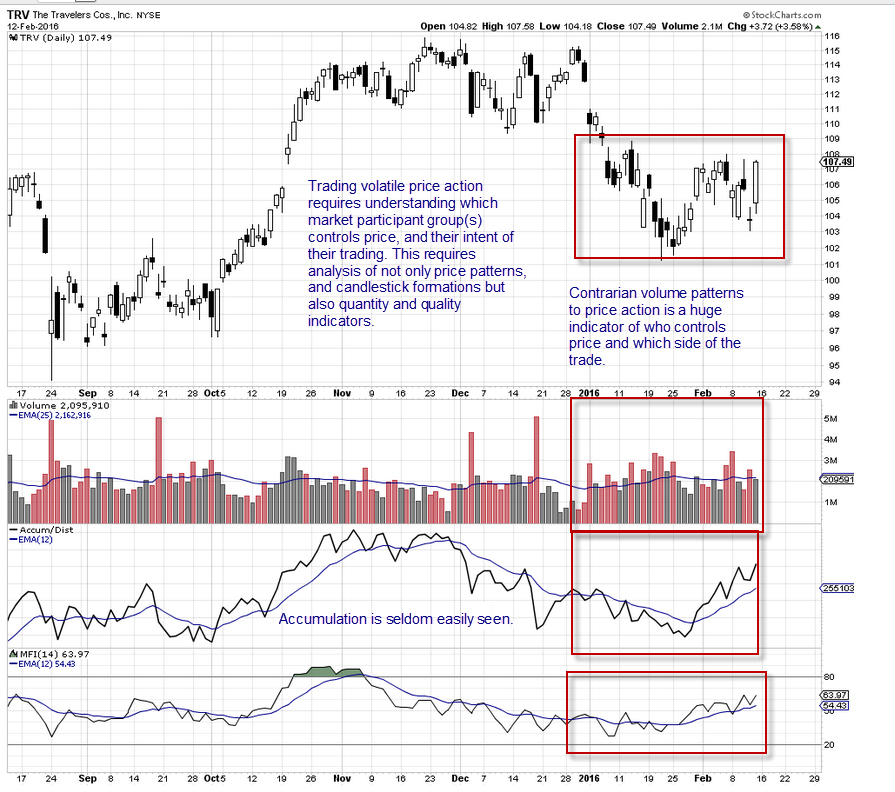 The price has shifted sideways, in a wide up and down day-to-day pattern. Most Technical Traders are unable to trade this kind of price pattern. However there are ways to trade this action, and more importantly there are several critical areas of chart analysis that tell a Trader whether this pattern will break to the upside or downside. The goal is to study not only price action but also Volume, Accum/Dist, Flow of Funds, and other Quantity and Quality Indicators. These indicators along with price, define which side is actually controlling price. When you know who controls price it becomes easier to enter, exit, and plan for the inevitable breakout knowing in advance which direction the stock will take.
It is important to study the relationship between how price is moving, the size of Volume Bars, the Accumulation patterns which often precede sudden big moves out of volatile price ranges, Compression Patterns, and Flow of Funds Indicators.
Summary
Learning to trade Volatile Market Conditions requires the ability to Swing Trade volatile patterns. This is a specialized area of Swing Trading that requires understanding the relationship between price and Volume, as well as Quiet Accumulation, Quiet Distribution, or Quiet Rotation.
Trade Wisely,
Martha Stokes CMT
www.TechniTrader.com
info@technitrader.com