Monitoring purposes SPX: Short SPX on 2/8/16 at 1853.44.
Monitoring purposes GOLD: Neutral
Long Term Trend monitor purposes: Short SPX on 1/13/16 at 1890.28

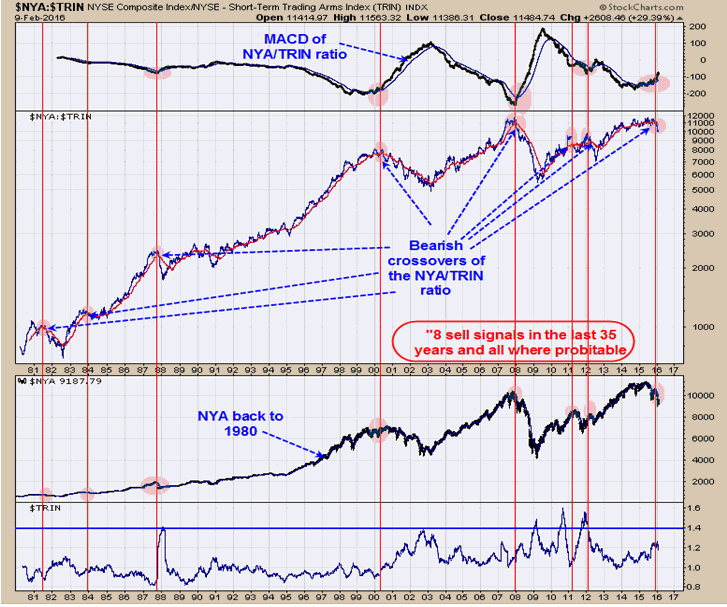
The red vertical lines on the chart above are the times when the moving averages of the NYA/TRIN ratio had bearish crossover for the sell signal. This chart goes back 35 years and there where eight bearish crossovers for the NYA/TRIN ratio and all where profitable. Therefore its rare to get a sell signal by this method and when there is one it pays to pay attention. The sell signals triggered since the 2000 top lasted a couple of months to a couple of years. Some previous important bottoms in the NYA where when the 100 day TRIN (Bottom window) reached 1.40 and above. Current 100 day TRIN is 1.19. As we have said, bottom form on panic and the TRIN readings help to define panic. With the current 100 day TRIN at 1.19, it suggests market has not reached the stage where there is enough panic to say there is a bottom here. Short SPX on 2/8/16 at 1853.44.
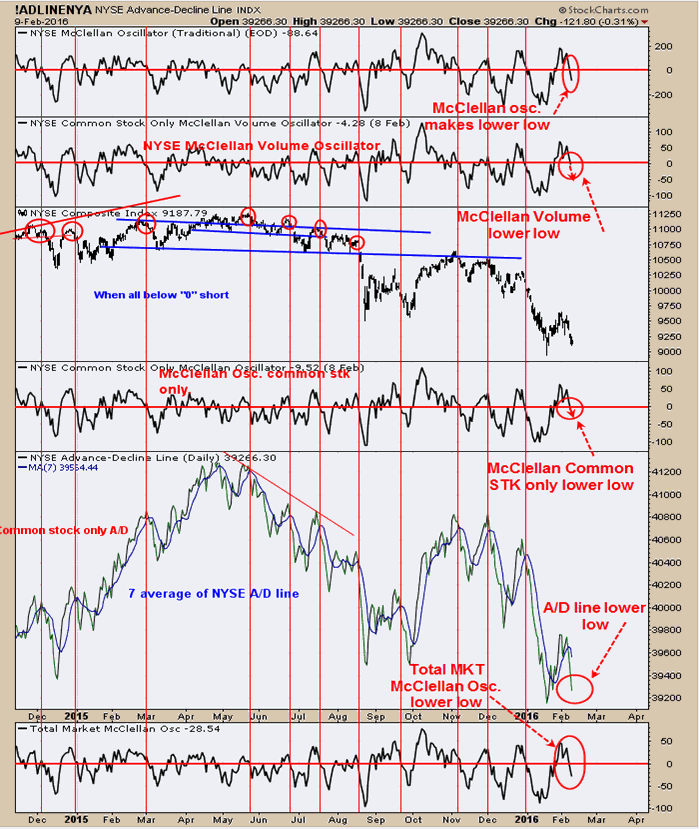
 Above is a momentum chart for volume and advance decline data. When down volume is outperforming up volume along with declining issues out numbering advancing issues the market is in a downtrend. The volume McClellan Oscillators and McClellan Oscillators help to identify those conditions. Even though today was a relative flat day the advancing issues where 938 and declining where 2155; over double declining issues compared to advancing issues and a weak condition for the market, though the market is nearly flat. Today the McClellan Oscillator; McClellan Volume Oscillator; McClellan Oscillator common stock only; and Total Market McClellan Oscillator made lower lows suggests the down trend is not done. We also did not see panic in the TRIN, TICK or VIX today.

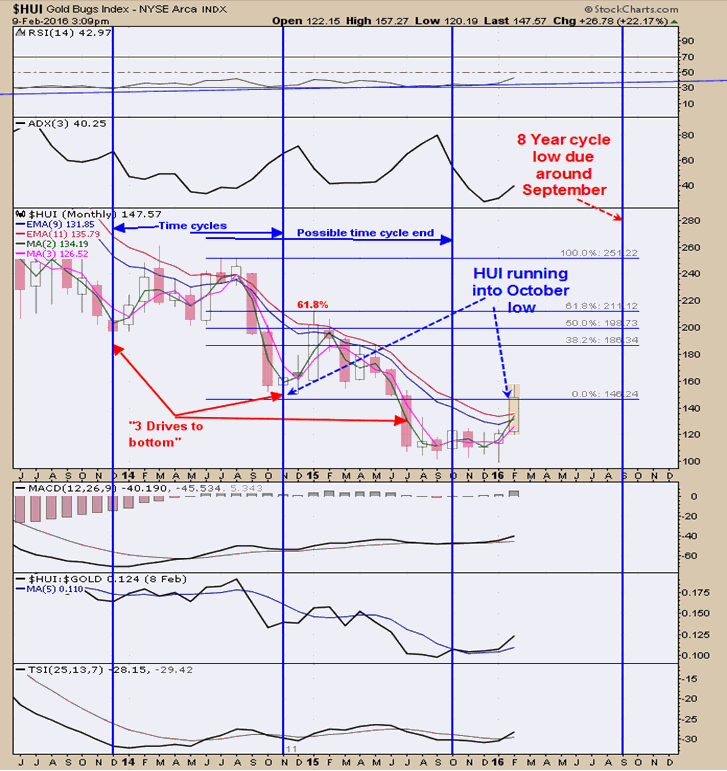
The Gold Commercials came in at -77,355 as of 2/5/16; previous week reading was -59,833. COT commercial readings below 50K are bullish. Above is the monthly HUI gold index. The pattern that appears to be forming here is a “Three Drives to Bottom”. To help identify this pattern the rally off of the second bottom needs to retrace at least 61.8% of the previous decline; and this one did. This pattern has an upside target to where it began and in the current example give target to 250 range. The “Eight Year Cycle” comes in near September which can arrive early or late by several months and it we are in that window. Notice that HUI is running into the November low and a resistance level. Market could stall here at this resistance area. Ideally one would like to see market push through or trend sideways at this resistance level but not retrace back down. If HUI can hold steady for a couple of weeks, it would build energy to push higher. If market retraced back down, say a 50% retracement, than that would take away strength of the current move up. Staying neutral for now but bigger picture appears to be turning bullish. For examples in how "Ord-Volume" works, visit www.ord-oracle.com.
Tim Ord,
Editor
New Book release "The Secret Science of Price and Volume" by Timothy Ord, buy on www.Amazon.com.
