
Monitoring purposes SPX: Sold long on 3/1/16 at 1978.35 = gain 3.12%: Long SPX on 2/19/16 at 1917.78.
Monitoring purposes GOLD: Short GDX on 2/24/16 at 19.11.
Long Term Trend monitor purposes: Short SPX on 1/13/16 at 1890.28
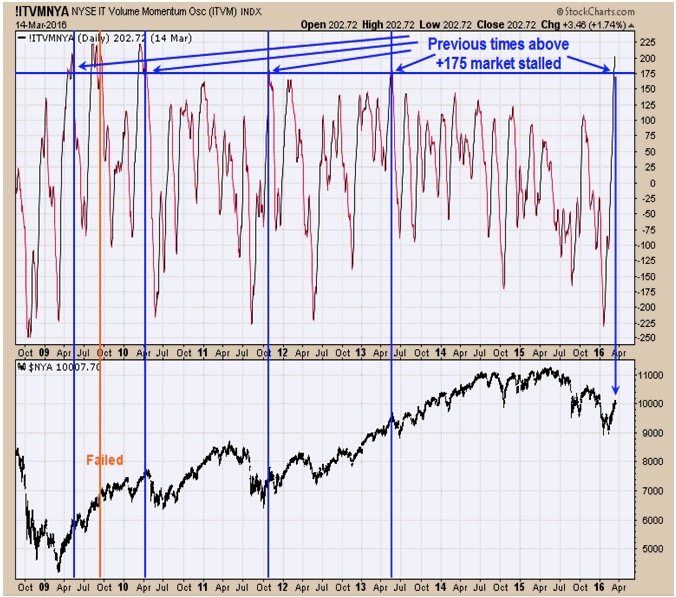
Above is the intermediate term Volume Momentum Oscillator. This chart goes back about 7 ½ years. When this Oscillator gets above +175 (which are rare) the market was near a short term high. Over the last seven years this Oscillator reached above +175 six times and five where at a respectable high. News events seem to market turns in the market. FOMC meeting announcement is tomorrow and may mark a high in the market. Sold long SPX on 3/1/16 for gain of 3.12%.
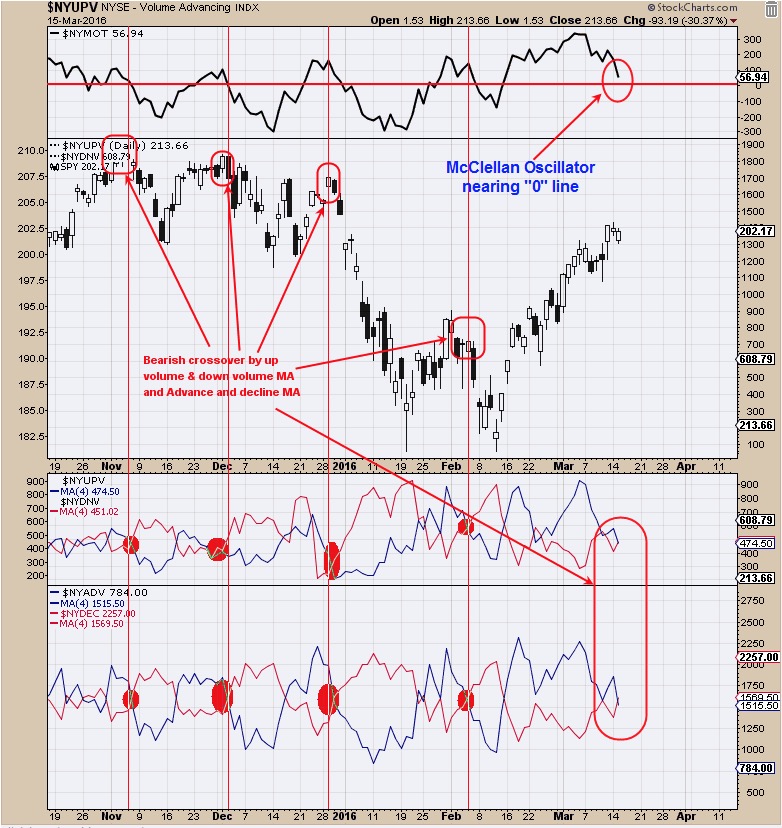 Top window is the NYSE McClellan Oscillator. A bearish sign for the market is when the McClellan Oscillator breaks below the “0” line. Today’s close came in at +56.94. Another weak day in the Advance/Decline line could push the McClellan Oscillator below “0” which will be a bearish sign. The bottom window is the NYSE advance issues with 4 period moving average and NYSE decline issues with 4 period moving average and today’s trading pushed this indicator to a bearish crossover. Next window up is the NYSE up volume with 4 period moving average and NYSE down volume with 4 period moving average. Though it looks like it has had a bearish crossover, it hasn’t. Any weakness in the up and down volume statistics and a break below the “0” line on the McClellan Oscillator will produce a sell signal. Tomorrows FOMC announcement could have an affect on these indicators. A top appears to be near on the SPX.
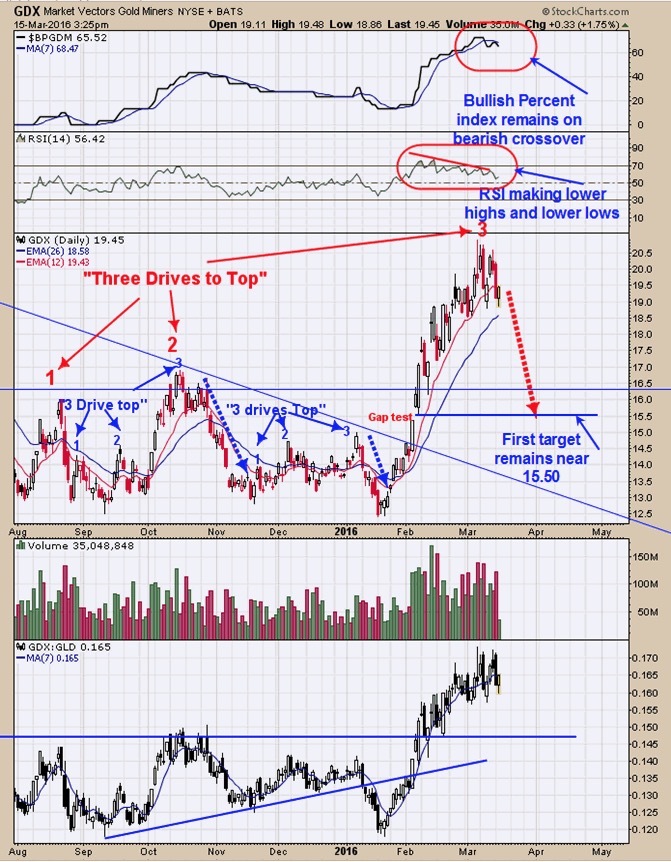
The Gold Commercials came in at -195,372 contracts as of 3/11/16; previous week reading was minus 171,431 contracts. COT commercial readings below -130K short can produce tops in Gold. The top window is the Bullish percent index for the Gold Miners which remain on a bearish crossover. Next window down is the RSI which has been making lower highs and lower lows suggests the trend has turned down for GDX. Our first down side target remains at the gap area of 2/11/16 near 15.50. However, if the pattern forming on GDX is “Three Drives to Top” than a pull back to 13.00 range is possible. We are short GDX at 19.11 on 2/24/16.
Tim Ord,
Editor
For examples in how "Ord-Volume" works, visit www.ord-oracle.com. New Book release "The Secret Science of Price and Volume" by Timothy Ord, buy on www.Amazon.com.