
Monitoring purposes SPX: Sold long on 3/1/16 at 1978.35 = gain 3.12%: Long SPX on 2/19/16 at 1917.78.
Monitoring purposes GOLD: Short GDX on 2/24/16 at 19.11.
Long Term Trend monitor purposes: Short SPX on 1/13/16 at 1890.28
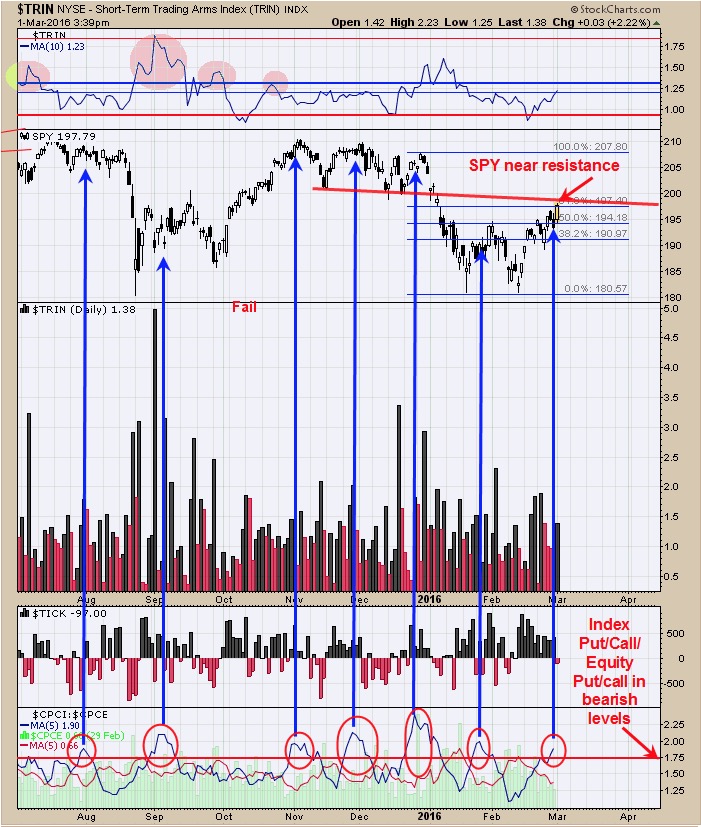
The bottom window is the CBOE index put/call/ CBOE equity put/call ratio. This ratio is a bearish sign for the market when it rises above 1.75. This ratio closed at 1.90 yesterday and we don’t have the numbers for today as of this writing, but most likely it pushed into a more bearish level. This ratio suggests upside is limited here for the SPY. Previously we had an upside target near 2000 range on the SPX which could still get there but in our opinion will be about the limit. We drew a trend line on the SPY which comes in near 198 and we are in that area now. Sold long SPX for gain of 3.12%.
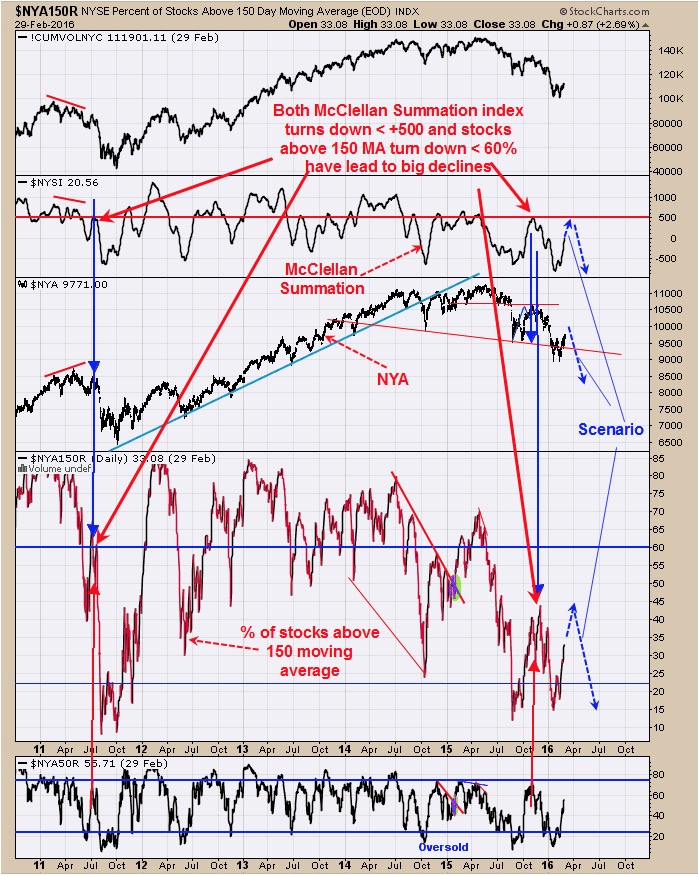
Today’s big surge in the McClellan Oscillator looks exhaustive but time will tell. The chart above helps to find big moves to the downside. When the McClellan Summation index turns down before reaching +500 and stocks above the 150 day moving average turns down before reaching 60% predict large declines. Today’s closing McClellan Summation index was +20.56 and the stocks above 150 day moving average stands at 33.05% and both in danger zone if market turns down from here. However, the McClellan Oscillator stands at +285 and to turn down the Summation index, the Oscillator will need to break “0” and will take time to do that, at least several more days. In that time we expect market will more or less tread water or move to our target near 2000 on the SPX. The next sell signal could produce a large decline unless the McClellan Summation index can get above +600 which in turn would turn the trend back to bullish. However, we don’t believe that will happen here, but could in September to October time frame; and more on that on a later date.
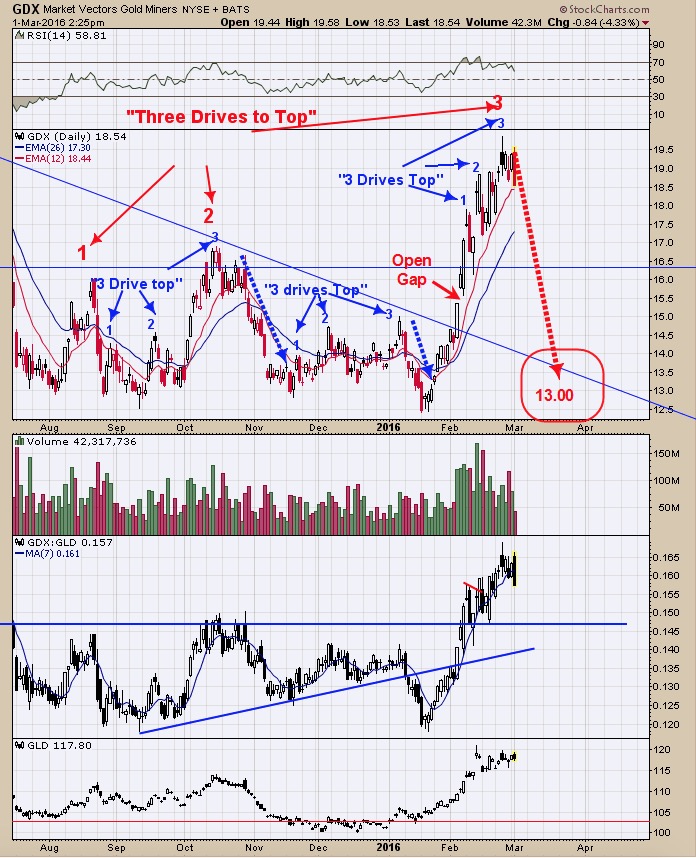
The Gold Commercials came in at -163,149 contracts as of 2/26/16; previous week reading was minus 131,984. COT commercial readings below -130K short can produce tops in Gold. Yesterday’s we reported on the weekly “Rate of Change” (ROC) and the weekly 10 period RSI for the GDX suggesting a extended market. The above chart is the daily GDX. We previous reported on the pattern that seems to be repeating which is the “Three Drives to Top”. This pattern suggests after the “Third top” is produced, the market will pull back down two where the pattern began. Since late August the “Three Drives to Top” patterns (see on chart) have been doing just that. Currently there is a large “Three Drives to Top” (noted in red) may be completing where the first Top is the August 2015 high; the second top is the October 2015 and the Third top is being completed now. If this large “Three Drives to Top” plays out, a pull back down to 13.00 is possible. Short GDX on 2/24/16 at 19.11.
Tim Ord,
Editor
For examples in how "Ord-Volume" works, visit www.ord-oracle.com. New Book release "The Secret Science of Price and Volume" by Timothy Ord, buy on www.Amazon.com.