
More Opportunities for Lower Capital Based Traders
One thing that is a constant in the Financial Markets and especially in the Stock Market over the past few years, is change. Everything about Technical Analysis is changing. That is often hard for Retail Traders, and Technical Traders who are Semi-Professional Traders making a high income from trading stocks, to keep up with all the changes.
Change is a good thing or at least should be perceived as a positive so long as traders are informed and are not trading like it’s 1979 which many still do, sadly. Even trading the way traders traded in the 1990’s does not work well anymore.
New Bottoming Formations for Technical Traders and new Topping Formations too have been one area of Technical Analysis that has changed dramatically, due to the plethora of new order types for the professional side of the market. Not much has changed however for Retail Traders using Retail Brokers, because retail brokerages have commoditized everything. Unfortunately for many new traders, they do not realize that there is a huge difference between “trading” aka entering an order in a broker software, and Technical Analysis which provides superb entries and reliable exits. Most Retail Traders simply use recommended stocks, so their Return On Investment ROI yields are very low compared to what a Professional Trader or Semi-Professional Trader earns.
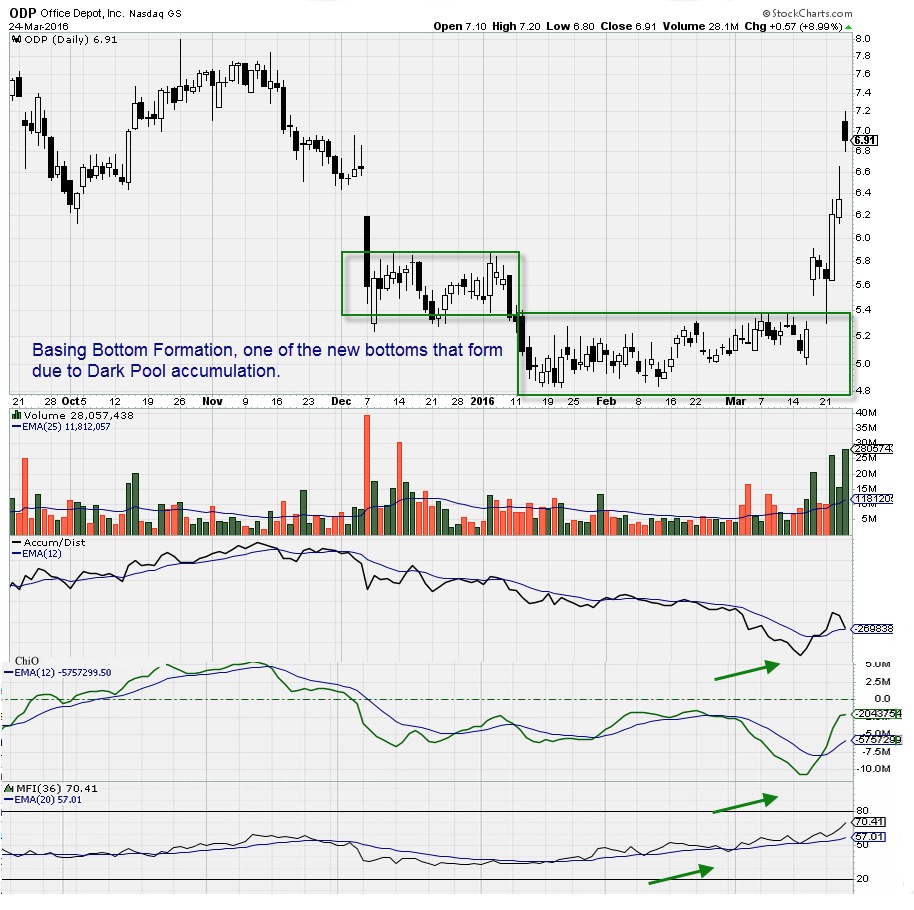
Today we will look at a chart example of Office Depot, Inc. (ODP: NASDAQ) which is a low priced, and often the price range that beginners need to study or lower capital base traders prefer.
There is definitely bias against under $10 stocks by many Retail Traders, but this is something to set aside. The Securities and Exchange Commission SEC has a pilot forward test program going on for “small cap” stocks, of which many trade under $10. The goal is to increase liquidity for the Dark Pools who requested this study. The spreads have been widened on the smaller cap stocks in this test and so there is more energy, more momentum, and thus more opportunities especially for traders who have limited capital resources.
ODP’s all time high is around $41. It is currently a super bargain for Dark Pools at $6-7 dollars.
One of the new Bottoming Formations for Technical Traders that develops when accumulation is underway is what is called a “Basing Bottom” which TechniTrader Staff identified, and have tracked and studied for several years now. It is usually a short term pattern that concludes with a sudden momentum accelerated price run upward.
Indicators that are volume based offer earlier convergence and divergence signals, and confirm the presence of Dark Pools. The key to recognizing these patterns as a Basing Bottom, is to understand the goals and intent of the giant Institutions who use Dark Pools and Twilight Pools to hide their huge lot orders.
This allows traders to enter the stock before price runs, or gaps up and runs. Early signals in candles and indicators is crucial to being able to use the Basing Bottom for Momentum Runs.
The giant Institutions intent of the purchase is to:
1. Buy a stock at a bargain price before others realize the company is turning itself around, and in future Earnings Reports the company will have strengthening Fundamentals.
2. NOT to disturb the trend or price action. Dark Pools who buy millions of shares of a company over an extended period of time used to show up on the exchanges. Consequently SOES bandits of the 1980’s, as well as Retail and Professional Traders of the 1990’s could see the large lot activity. Now their large lot buying is hidden off the exchanges, BUT shows up in your charts IF you know what to look for in candlestick and volume based indicator patterns.
3. When accumulation is completed, they allow everyone else to move price upward.
Summary
All Retail and Technical Traders need to accept the fact that Technical Analysis is evolving. It is important to not be resistant to changes, and to be open-minded toward learning the new patterns including new Bottoming Formations for Technical Traders.
Technical Analysis is not static, it changes and evolves as the Market Structure changes. We have had more changes in Market Structure in the past few years than at any other time in the history of the market. Therefore it is important to recognize that since the Market Structure has changed, technical patterns are also changing.
Trade Wisely,
Martha Stokes CMT
www.TechniTrader.com
info@technitrader.com