
Monitoring purposes SPX: Neutral
Monitoring purposes GOLD: Long GDX on 4/14/16 at 21.60
Long Term Trend monitor purposes: Short SPX on 1/13/16 at 1890.28
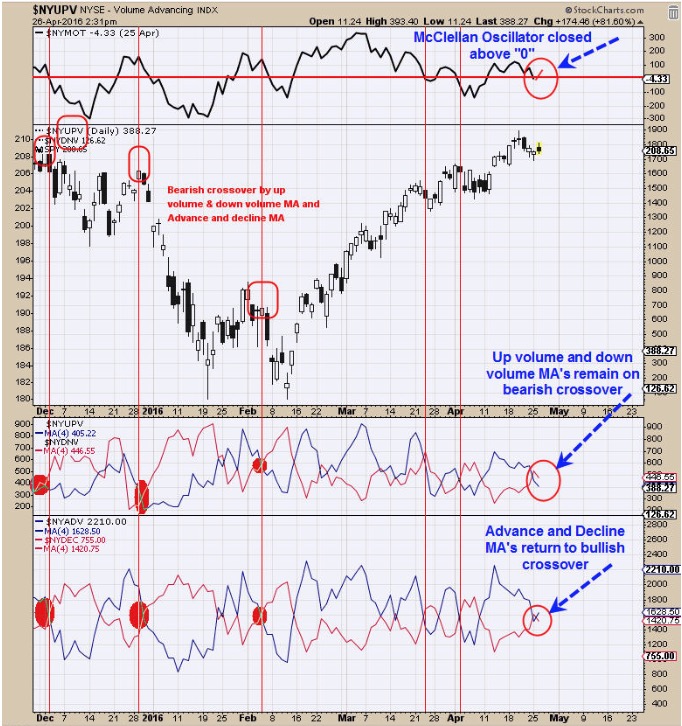
The FOMC meeting started today and runs into tomorrow and may have a short term affect on the market. The above chart takes a short term view of the market. Yesterday the McClellan oscillator fell through the “0” line and a bearish short term sign and today it turned back up and closed above “0” which in turn is now bullish. The bottom window is the NYSE advancing issues with four period moving average and NYSE declining issues with four period moving average and these moving averages had a bearish crossover yesterday and today’s market action produced a bullish crossover. Next window up is the NYSE Up volume with four period moving average and NYSE down volume with four period moving average which had a bearish crossover yesterday and today’s trading kept this indicator on a bearish crossover. Of the three bearish indicators on this page yesterday, two turned back to bullish today. The FOMC meeting could have a short term impact on the market, so we will wait and see what it brings. We are still expecting a down month of May and we are actively looking for a top in this region.
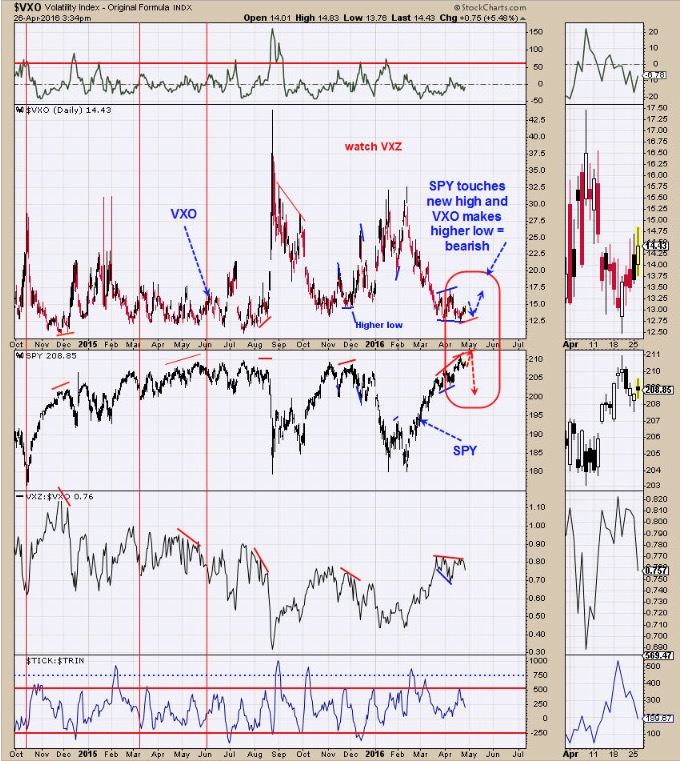
We showed this chart yesterday. We discussed the VXZ/VXO ratio on Yesterday’s report, which is showing a bearish sign. Today we will look at the VXO. The VXO is the original formula for the VIX. When SPY makes higher highs and the VXO makes higher lows, it suggests a top is nearby for the SPY. Over the last couple of weeks the SPY has worked higher and the VXO has worked lower and showing no divergence. With the McClellan Oscillator showing strength today, a rally into the FOMC announcement is possible tomorrow. If the SPY touches a new short term high and the VXO makes a higher low, a bearish divergence would show up. We have bearish signs here but no signal as of yet.
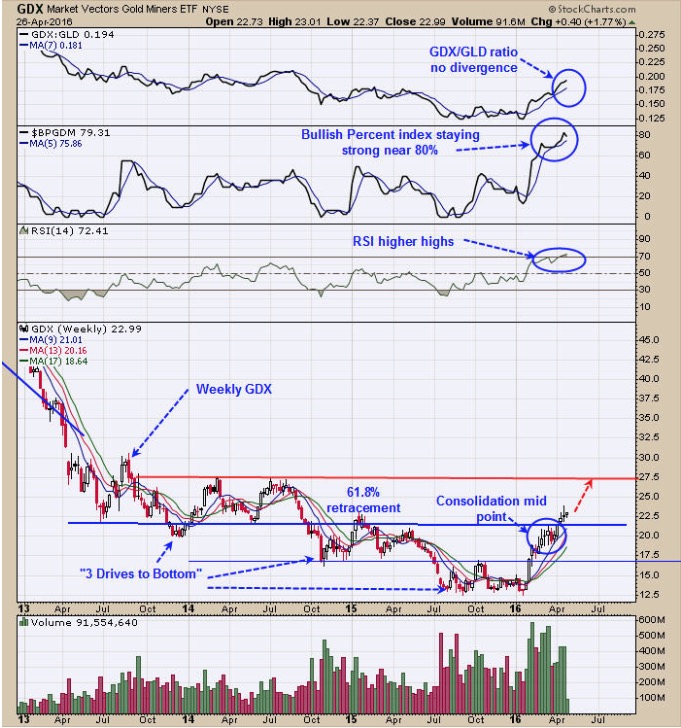
The Gold Commercials came in at -240,121contracts as of 4/22/16; previous week reading was minus 231,787 contracts. Though gold may stubble short term the gold stocks may stay strong. We put our stop on GDX at 21.60. The above chart is the weekly GDX. The pattern that formed beginning back in late 2013 appears to be a “Three dives to Bottom”. This pattern has an upside target to where it began and in this case a target to 27.00 range. The consolidation from mid March to early April appears to mark the half way point of the move up which also gives a target near 27.00. So for the RSI is making higher highs as GDX is making higher highs and no divergence is present. The bullish Percent index is staying near 80% showing that 80% of the stocks in the Gold miners index are on point and figure buy signals. The top window is the GDX/GLD ratio which is trending higher and remains bullish. Long GDX at 21.60 on 4/14/16; Stop at 21.60 on 4/26/16.
Tim Ord,
Editor
For examples in how "Ord-Volume" works, visit www.ord-oracle.com. New Book release "The Secret Science of Price and Volume" by Timothy Ord, buy on www.Amazon.com.