
Monitoring purposes SPX: neutral.
Monitoring purposes GOLD: Short GDX on 2/24/16 at 19.11.
Long Term Trend monitor purposes: Short SPX on 1/13/16 at 1890.28
This is the week before option expiration week and a week where whipsaws are common. An interesting note, If April 1 was positive (which it was) than April is up 83% of the time. Another interesting note is that the first half of April is normally weak and second is strong. Option expiration week normally has a bullish bias which is next week and the April Strength may start then.
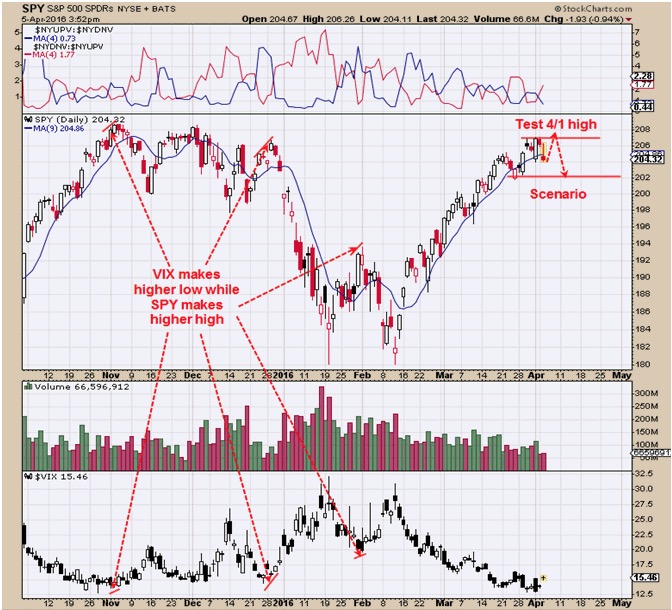
The chart above is the daily SPY. On Friday the volume reached the highest level over the last two weeks and most high volume days are tested and if tested on lighter volume would imply a resistance level has been reached. We are thinking for short term that Friday’s high will be tested. We have also noticed that if market makes higher high and VIX makes a higher low, the odds increase that a short term top is forming. Last Friday SPY hit a new high and VIX hit a new low suggesting the uptrend is intact. However, if the test of 4/1 high comes to past on lighter volume and VIX makes a higher low than odds increase for a pull back. Request free 30 day TRIAL.
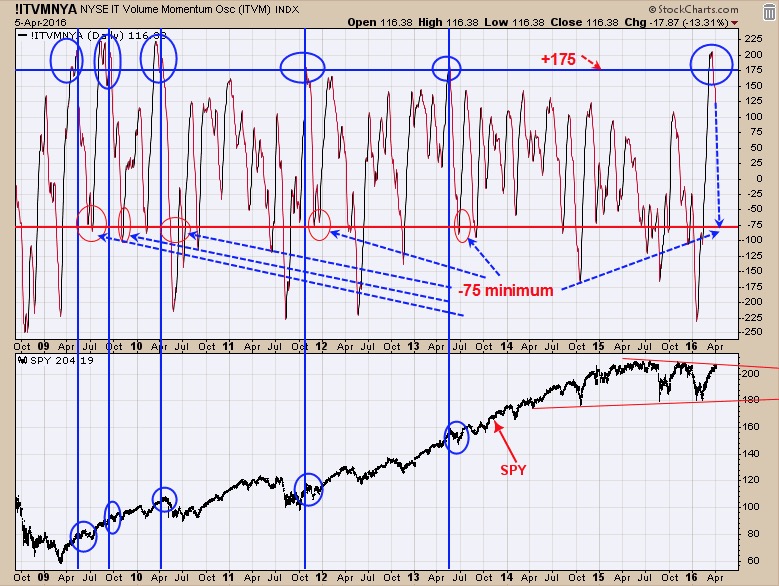
The chart above is the Volume momentum Oscillator. Readings above +175 has stalled the market short term and that level was hit last week. In most cases the pull back on the market after hitting +175 on the Volume momentum Oscillator has been mild (circled in blue) and we expect that to be the case this go around. Minimum Volume Momentum Oscillator pull back is expected to get below minus 75 for the expectation for a bottom in the market starts to form. Follow us on twitter https://twitter.com/ordoracle
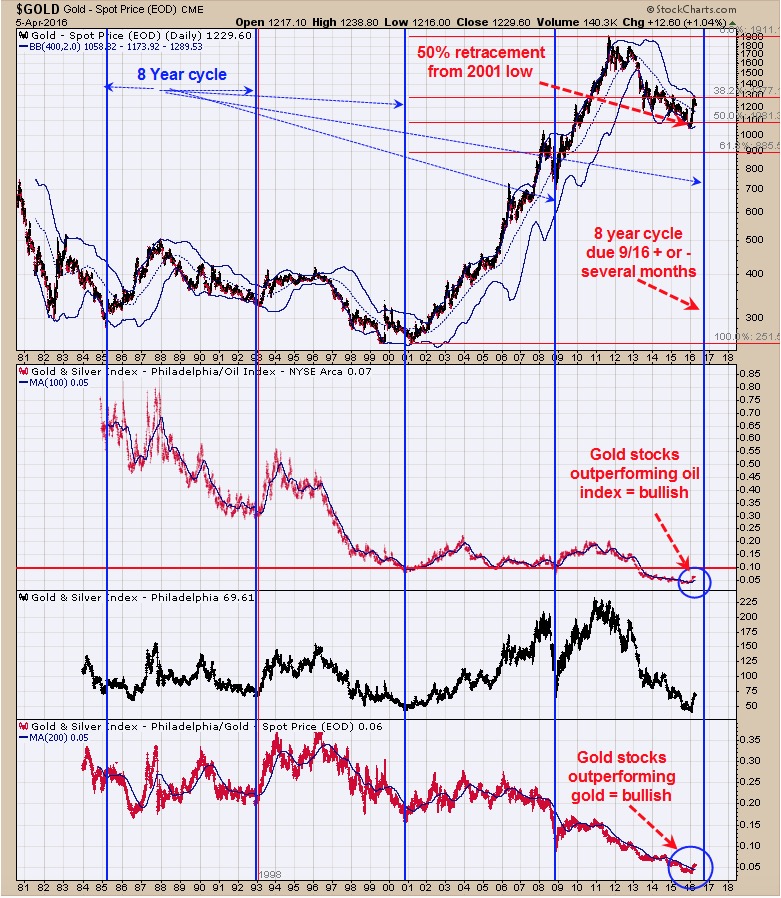
The Gold Commercials came in at -207,964 contracts as of 4/1/16; previous week reading was minus 199,994 contracts. A short term bearish sign for gold when Commercials are below -150K short. Having said that, the chart above is the daily gold chart going back to 1981. The blue vertical lines are when the eight year cycle for gold is present. The next cycle is due in September of this year. This cycle can be early or late by several months and there is a good change that the low came in December 2015. The bottom window is the XAU/Gold ratio which has been in a downtrend since 2011, has had a bullish crossover. When this ratio is rising than Gold stocks are outperforming gold and a bullish sign for both. The middle window is the XAU/XOI (oil index). When Gold stocks are outperforming the oil index, it a bullish sign for the gold stocks and this ratio also has had a bullish crossover. There is evidence that a bull market has started in gold that may last eight years. However the short term picture suggests a pull back is possible over the coming weeks. We are short GDX at 19.11 n 2/24/16.
Tim Ord,
Editor
For examples in how "Ord-Volume" works, visit www.ord-oracle.com. New Book release "The Secret Science of Price and Volume" by Timothy Ord, buy on www.Amazon.com.