
Monitoring purposes SPX: short SPX on 4/29/16 at 2065.30
Monitoring purposes GOLD: Long GDX on 4/14/16 at 21.60
Long Term Trend monitor purposes: Short SPX on 1/13/16 at 1890.28
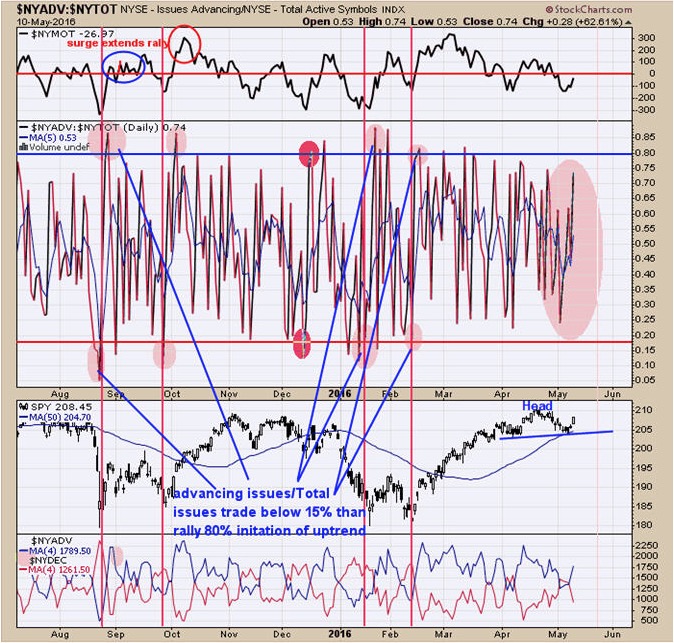
According to the NYSE advancing issues compared to the NYSE total issues traded, an impulse wave up is not starting here. The initiation of an uptrend begins with an oversold condition in the market which is the Advancing issues reach 15% of total issues traded than reverses strongly where the Advancing issues reach above 80% (see chart above). The recent decline did not produce an oversold condition below 15% of the advancing issues compared to total issues traded. Today’s rally also did not produce a strong showing where the advancing issues reached 80% of the total issues traded. What could be forming here is a Head and Shoulders top where the late April high is the Head and the Right Shoulders is forming now; or market is building a sideway pattern and the recent low will be tested again and find support. We are expecting May to be a down month but at this point we don’t know how much.
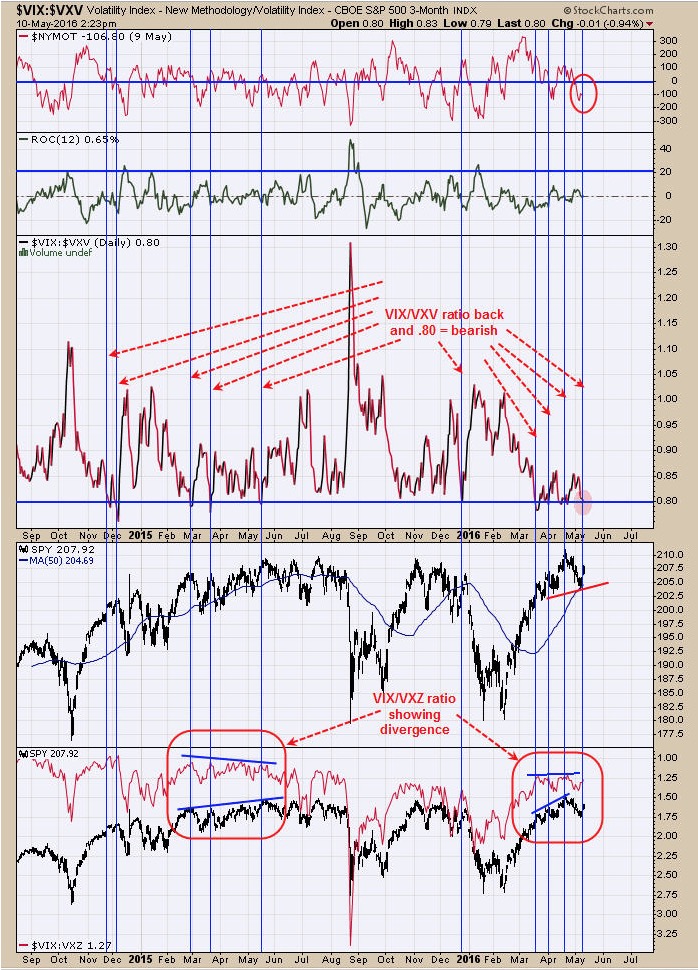
The middle window is the VIX/VXV ratio. Readings at .80 or less have accompanied short term consolidations along with short term tops. Today’s reading of .80 on this ratio suggests upside is limited. Another ratio that is showing a negative sign is the VIX/VXZ ratio in the bottom window. When SPY pushed to a new short term high in late April, this ratio failed to confirm. This is the week before option expiration week where whipsaws are common. It would appear to us another pull back is coming as the upside appears limited according to these ratios. Short SPX on 4/29/16 at 2065.30.
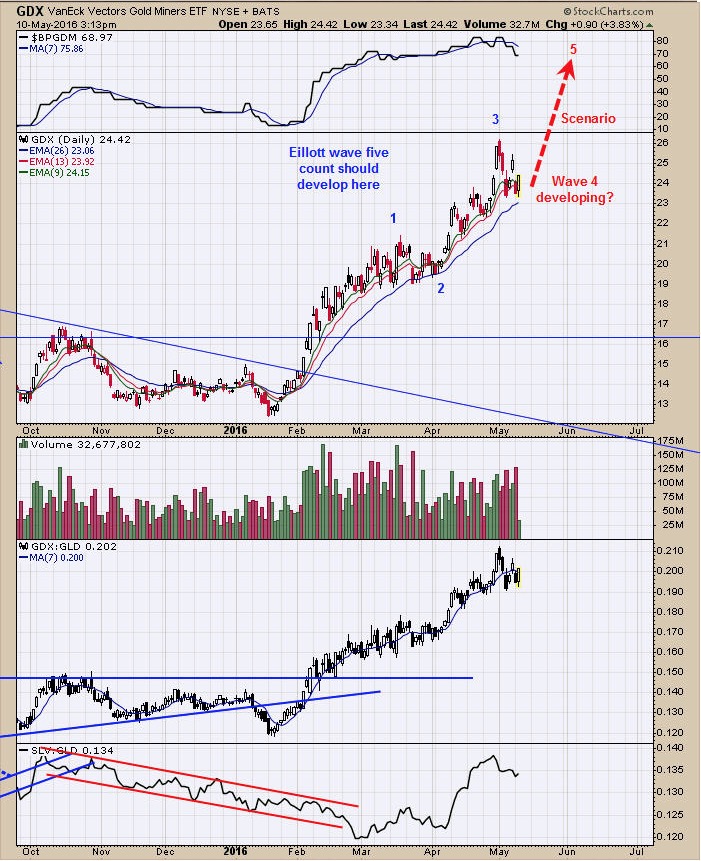
The Gold Commercials came in at – 294,901 contracts as of 5/6/16; previous week reading was minus -240,108 contracts. The chart above is the daily GDX. In Elliott wave terms, in bull markets a five count up is expected and in bear markets only a three wave up pattern is expected. So far we can count only Three waves higher. If this is a bull market in Gold stocks (identified with the monthly RSI on GDX closing above 50 at the end of April) than the current rise in GDX should unfold in an Elliott Wave five count up. There is a possibility that Wave 3 finished at the May 2 high and the current pattern forming is a Wave 4. Once Wave 4 completes than Wave 5 will start and break to new highs. There is also a count where Wave 3 is not finished which would have a more bullish outcome. But for now, it appears Wave 5 is still in front of us and the rally from the February low is still incomplete. Long GDX at 21.60 on 4/14/16; Stop at 22.00 on 5/2/16.
Tim Ord,
Editor
For examples in how "Ord-Volume" works, visit www.ord-oracle.com. New Book release "The Secret Science of Price and Volume" by Timothy Ord, buy on www.Amazon.com.