
Monitoring purposes SPX: Covered 5/13/16 at 2046.6 = .9 gain; short SPX on 4/29/16 at 2065.30
Monitoring purposes GOLD: Long GDX on 4/14/16 at 21.60
Long Term Trend monitor purposes: Short SPX on 1/13/16 at 1890.28
The FOMC minutes will be released for April 26-27 meeting tomorrow at 2:00 PM and could put short term volatility in the market. The pattern that appears to be forming is a Head and Shoulders top where the Head is the April 20 high and the Right Shoulder appears to be forming now. There are symmetry in Head and Shoulders patterns both in time and price. The Left Shoulder has two humps and to keep the symmetry the Right Shoulder should also have two hump and we count just one so far. There is time symmetry also and to keep the time symmetry the right Shoulder should end tomorrow or Thursday. With the FOMC minutes due at 2:00 PM tomorrow, the bounce needed to complete the symmetry of this Head and Shoulders pattern both in time and price could be completed. SPY has resistance near the 208-209 range. Still bearish and looking for the next signal.
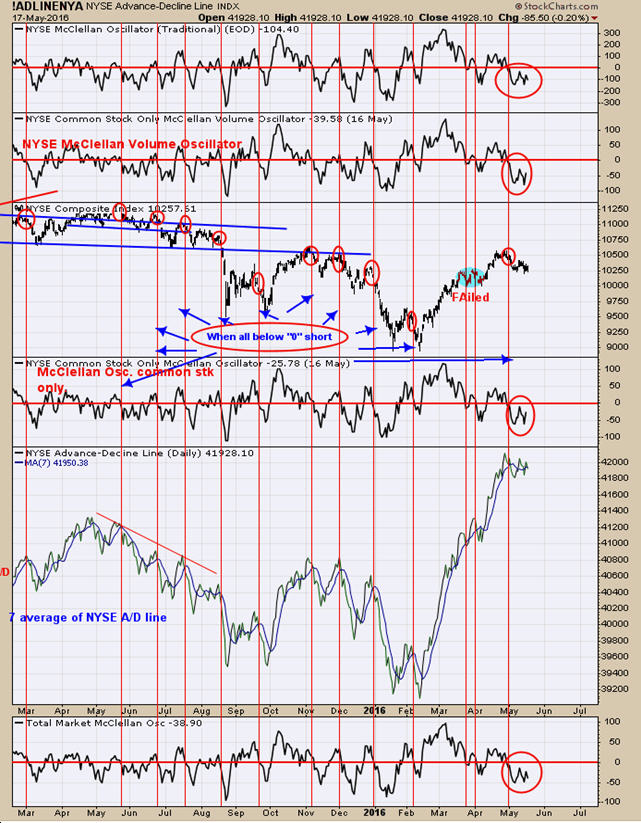
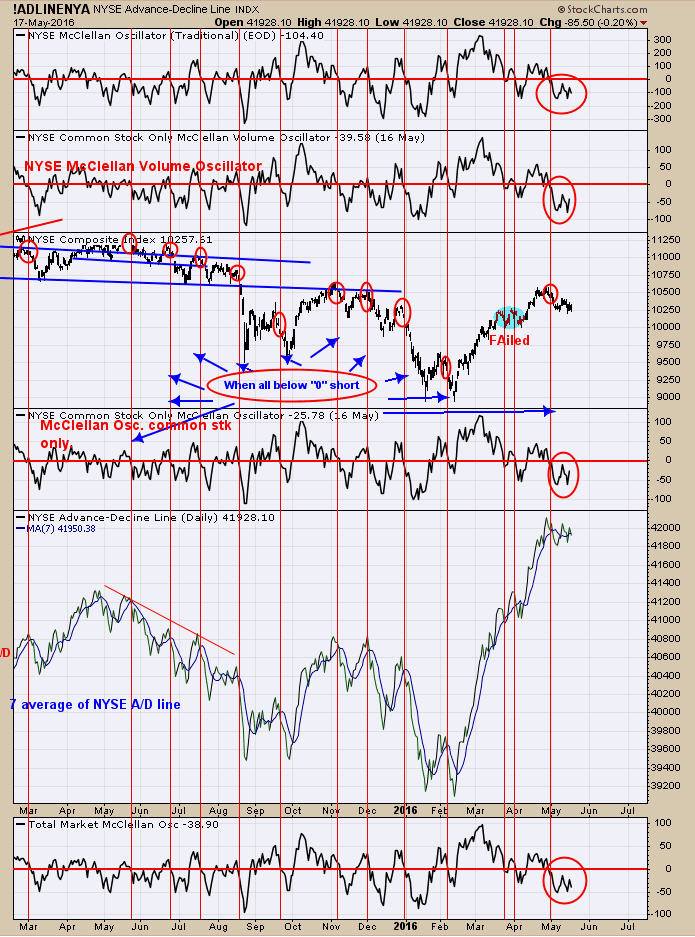
The chart above helps to define the trend of the market. The Top window is the NYSE McClellan oscillator; next window down is the NYSE Common stocks only McClellan Volume Oscillator; Bottom window is the Total Market McClellan Oscillator and middle window is the NYSE Common stocks only McClellan Oscillator. When all of these Oscillators are below “0” than the market is considered in a down trend; and all are below “0”. Therefore we have a bearish view of the market until the Oscillator close above “0”.
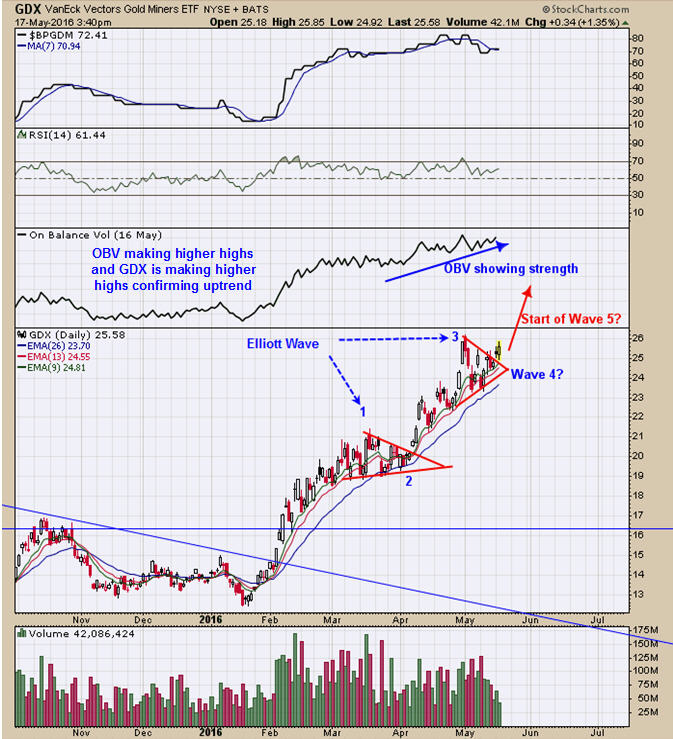
The Gold Commercials came in at -284,996 contracts as of 5/13/16; previous week reading was minus – 294,901 contracts. The chart above is the daily GDX. The Third window down from the top is the “On Balance Volume” (OBV) chart and so far OBV has made higher highs as GDX made higher highs confirming the uptrend. It still appears to us that an Elliott wave five count up is in progress and Wave may have ended Friday and Wave 5 may have started on Monday. In bull markets a five count up is expected and in bear markets only a three wave up pattern is expected. This bull market in Gold stocks was identified with the monthly RSI on GDX closing above 50 at the end of April. GDX is also staying above the longer term moving average of the 13 and 26 day. Long GDX at 21.60 on 4/14/16; Stop at 23.00 on 5/17/16. For examples in how "Ord-Volume" works, visit www.ord-oracle.com. New Book release "The Secret Science of Price and Volume" by Timothy Ord, buy on www.Amazon.com.
Tim Ord, Editor
www.ord-oracle.com