
Rationales & Targets
Wendy’s recently reported plans for self-serving kiosks that will ostensibly cost far less than the $15 per hour minimum wage that is highly anticipated somewhere down the road. Of course. Why and how could fast food operators ever afford a “living” wage for the woefully inexperienced segment of the labor force? Factor in medical care coverage and as far as the eye can see are waves of bankruptcies and those with a “living” wage out of work. And now, McDonald’s is planning the same as CEO Ed Rensi said last week, “...it’s cheaper to buy a $35,000 robotic arm than it is to hire an employee who’s inefficient making $15 an hour bagging French fries - it’s nonsense and it’s very destructive and it’s inflationary and it’s going to cause a job loss across this country like you’re not going to believe." We hasten to add the word “soon.” The wheels of progress are in motion. Expect jobs to suffer.
Our “key” support level of Dow 17,399 held on a closing basis on May 19th. That support enabled the rally since that now appears to be running into resistance. Volume has been lower than normal, which tends to reduce the validity of this recent bounce. We still see room for an eventual upside test of the April high of Dow 18,167 but frankly, time is running out. The fact that divergences are still visible is quite troubling. Typical bull market dynamics have entirely disappeared. Despite a better than three month rally from the January low, we saw no improvement in any of the negative divergences we had previously shown. Key support is now Dow 17,331.
Consumers Stressed Out
In January, California Governor Jerry Brown put forth spending plans for the next fiscal year. Those plans are already being scrapped as tax revenues have collapsed, down $869 million from projections. The plunge was mostly due to income tax revenues as April’s revenues were $1 billion below expectations. Zero Hedge suggested a continuing emigration, citing a study of IRS tax returns showing 250,000 people moved out of California from 2013-2014. It’s not only state revenues that are suffering. It’s pension plans. The Central States pension plan is looking to partially reduce the pensions of 115,000 retirees and the future benefits for 155,000 current workers. Although proposed cuts amounted to as much as 60%, even this was not enough to convince the Treasury Department. They rejected the proposal because the plan would nevertheless be insolvent. There were also negative reports about Chicago’s Municipal Employees Annuity and Benefit Fund recently. Net pension liability soared to $18.6 billion from $7.1 billion a year earlier, as new accounting rules no longer allow assumptions of aggressive investment returns.
Consumers are not blind. The impact of all the above circumstances must eventually affect consumer spending. We believe a significant economic contraction is already underway.
Repeat Performance
- This article is an excerpt from the current issue -
- A free three issue trial to Crosscurrents is available upon request -
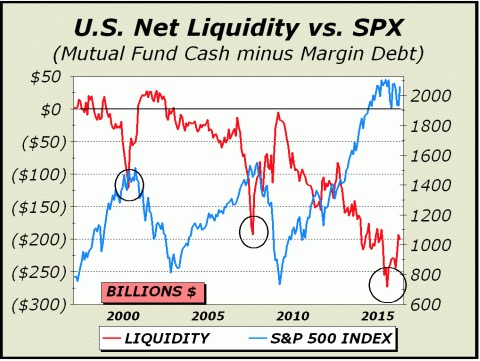
Our current analysis typically measures total margin debt versus GDP, which we believe gives us an even better picture of the dynamics at work. Obviously, the larger margin debt is versus GDP, the more speculation is concentrated in stocks. During the tech mania of 1999-2000 and the housing and stock manias of 2007, margin debt approached but never quite made it to 3% of GDP. However, in April of 2015, margin debt actually got to the 3% level relative to GDP, the worst measurement since the madness of 1929 and solid evidence of the third mania for stocks within the last 15 years.
We repeat, there will never be another period like the years 1926-1929 but there likely will also never be another 15-year stretch that witnesses three separate stock manias. The situation for risk is as dire as we have seen in over five decades of observation. It’s not only the massive exposures, it’s valuations, which have remained at extremely elevated levels since roughly 1998, when the tech mania really began to take off, with only a brief time out into the 2009 lows. You can find a chart of Shiller’s cyclically adjusted p/e (“CAPE”) going back to 1880 at bit.ly/1pOuH9F.
The chart at center lays out the best case for a substantial price decline. Since the major indexes peaked a full year ago in May 2015, we believe a bear market is already in progress. While our indicator has moved off the low of $272.7 billion established in June 2015, the current measurement of $200 billion is nonetheless enormous and has only been exceeded 19 times. All of the higher measurements have come in the period since December 2013. The last month in which liquidity was positive was May 2002. Given our chart data has a limited history, one might be excused for believing negative liquidity episodes such as those pictured were the rule rather than the exception. One would be wrong. The three instances of extreme negative liquidity shown here are the only instances we have found dating back over five decades.
For more information, please contact us:
Alan M. Newman, Editor, Crosscurrents
www.cross-currents.net