
Rationales & Targets
Apropos comments made on page three, Janet Yellen, the Chair of the Board of Governors of the Federal Reserve, has often spoken of the wealth effect. There is a widespread supposition that every dollar increase in household equity wealth generates two to four cents in additional spending. The supposition also holds that every dollar increase in residential wealth yields nine to as much as 15 cents in additional spending. Thus, a bull market that adds $5 trillion in wealth and a robust housing market that adds another $5 trillion in wealth is presumed to add a minimum of $550 billion in GDP, which would take growth from a weak 2% to a far more reasonable 5.3%. The problem is, it doesn’t quite work.
Clearly, the Fed did not promote tech stocks in the late 1990s, but average GDP growth of 6% from 1996-2000 was certainly capable of driving both stocks and housing. If the Fed attempts to lift financial markets to provide stimulus, all that occurs is assets become mispriced. As we saw at the tech mania peak in 2000 and the manic housing and stock peaks in 2007, mispriced assets can only lead to subsequent disaster. Stocks are currently overvalued by at least 20% and possibly as much as 40%. We do not see a way for stocks to shed their excess valuation simply by the passage of time. There is simply too much potential for volatility from all forms of mechanized trading for a stable environment to endure. A move below Dow 17,331 should mean a test of the next support at 16,485 and we would treat that as major support. If it breaks, we should see our 14,719 downside target.
Brexit Overdone (For Now)
Frankly, we’re not concerned that BREXIT spells more than temporary trouble for U.S. stocks at this time. As usual, markets overreact, and Friday’s reaction to the unexpected “leave” vote for the UK was massively overdone. It will likely take as long as two years for Britain to exit the European Union and in any event, the EU has lots bigger problems than dealing with one less partner. Those problems are illustrated by the iceberg shown below. Greece is still shrinking after its massive 2010 bailout totaling EU110 billions and BP91 billions, an amazing feat of malfeasance. Although contracting at a lesser pace than before, 0.5% lower GDP in the first three months of 2016 screams more trouble is coming. As for Portugal, Italy and Spain, GDP growth has been minimal with Italy and Portugal barely positive. Perhaps the EU could survive another Greece in the form of also small Portugal, but they cannot afford problems in Spain or Italy, respectively six and nine times the size of Greece. This is where the long term can be of consequence. If Spain and Italy ever require bailouts, we will not walk, we will run for the nearest exit.
Gold Rises Over 25%
Please note: a free three issue trial to Crosscurrents is available upon request.sa
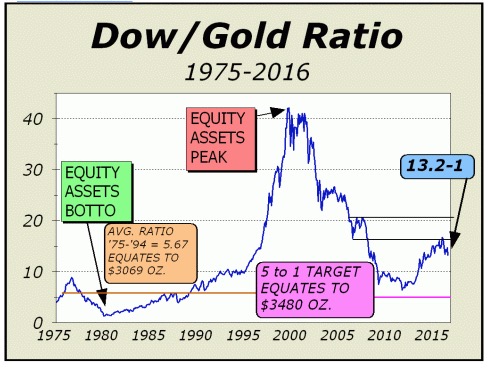
Gold bullion has moved strongly from the December bottom around $1060 per ounce and at last week’s peak, had risen over 25%. While we are still in the camp that claims the precious metal is in a super bull market, we would caution that we do not yet see a total all-clear signal. However, we are quite encouraged that the lower support line on the chart at bottom right held at roughly 16.5-1. The upper line was a worst case scenario which frankly could have put the entire thesis in doubt. The move back to a Dow/Gold ratio of 13.2-1 is the best we have seen since July 2014 and despite our inability to illustrate an all clear, buttresses our confidence substantially.
As well, we see huge breakouts for the two largest gold stocks, Barrick Gold Corp. (ABX) and Newmont Mining (NEM). Frankly, we’d feel a lot more confident if we also witnessed the same kind of action for two other gold stocks we favor, Goldcorp (GG) and Eldorado Gold (EGO), but both are trading at only a 15-month high, whereas the two majors are trading at their highest levels since the spring of 2013.
We would also note that the HUI American Gold Bugs Index and the XAU Philadelphia Gold/Silver Sector Index charts have a long way to go before establishing that gold stocks are on their way to new all time highs. A lot of work still needs to be done. The HUI is currently at 237.88 and will hopefully not break below the May 25th level of 194.64. The XAU is currently 93.70 and needs to hold above the May 31st level of 78.62. Breaks below these levels would place the next leg of the super bull market further out in time. If our thesis is correct, the HUI will eventually trade well above the 20111 high of 635 and the XAU above 233.
Regarding super bull potential, we foresee an eventual Dow/Gold ratio of between 5-1 to 5.67-1. The latter represents the average ratio from 1975-1994 and would equate to gold over $3000 per ounce with the Dow at present levels. This would presumably take the entire gold stock sector to new highs by a wide margin. We would caution that we are not buying at this moment but are always ready to add to positions on pullbacks.
For more information, please contact us:
Alan M. Newman, Editor, Crosscurrents
516-557-7171
www.cross-currents.net