
Monitoring purposes SPX: Long SPX on 6/27/16 at 2000.54.
Monitoring purposes GOLD: Sold GDX on 6/10/16 at 25.96 = gain 14.97%. Long GDX on 5/31/16 at 22.58.
Long Term Trend monitor purposes: Short SPX on 1/13/16 at 1890.28
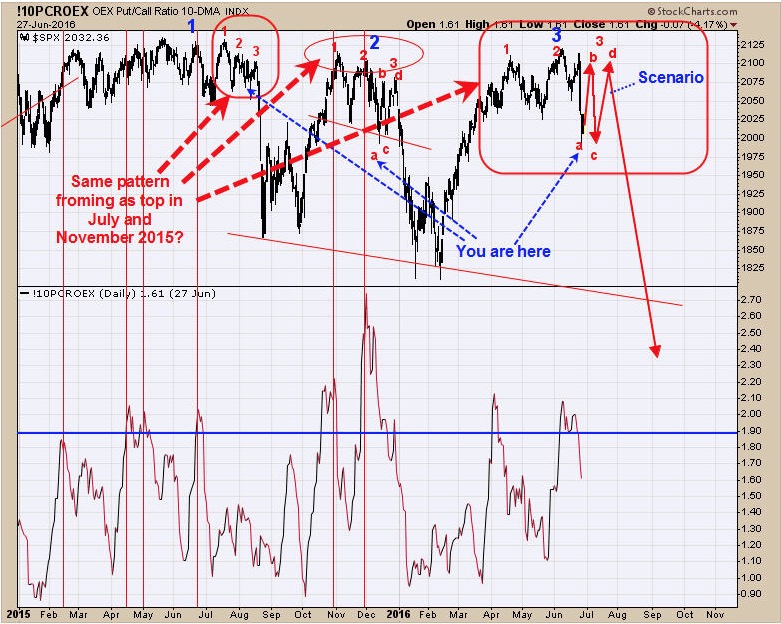
Yesterday we presented a “road map” of what may follow in the SPX. We have revised that outlook in the above chart. A pattern that has been forming at the last two tops and that may be playing out again is three tops and the third top forms in a abcd pattern. In a nutshell, yesterday’s low could be point “a” (the top in late July of last year is a little hard to see but is similar to top in November 2015). If this is point “a” than a strong fast rally will ensue and possible rally back to test the gap level on the SPY near 208 (2080 on SPX) to point “b” than down again. Before we go much further in our analysis, lets see if we get to point “b” first. Long SPX at 2000.54 on 6/27/16.
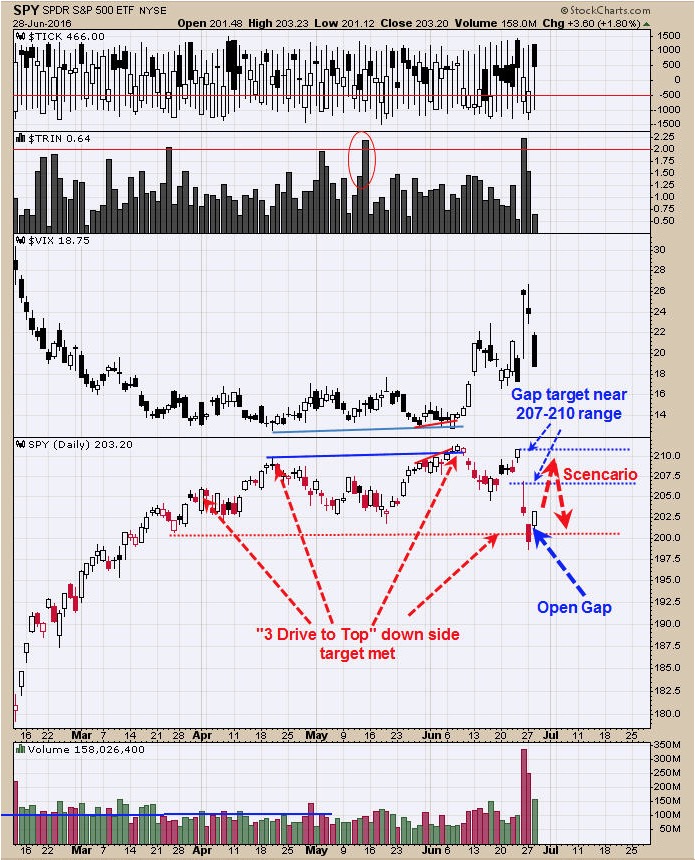
The “Three Drives to Top” has been completed and met its downside target near 202 level. A gap formed on June 24 that starts near 210 and extends down to 207 and may be the next upside resistance level. Today’s open also formed a gap and will be filled at some point. For now we are looking for a rally back up to 208 range on the SPY (plus or minus one point) where market may find resistance. If the 6/24 gap is tested on lighter volume then that condition will suggests the gap as resistance and market may fall back and test today’s gap level near 202. This scenario matches up well on page one commentary. Long SPX on 6/27/16 at 2000.54.
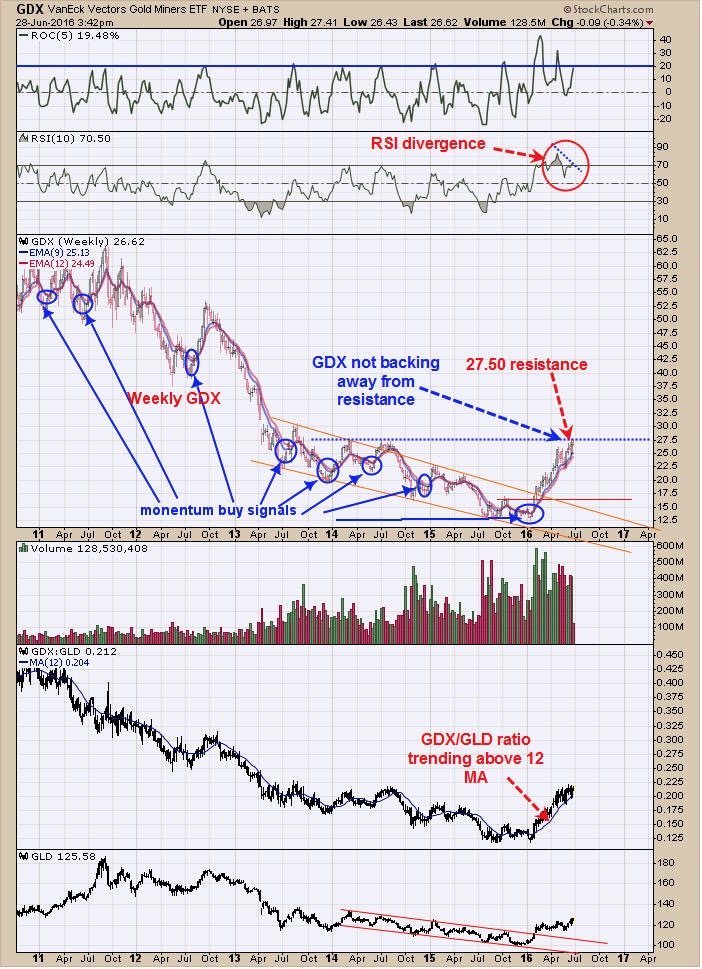
Above is the weekly GDX chart. GDX is running into resistance near the 27.50 range which is the highs of April and August 2014. Over the last couple of weeks GDX has not backed away from that resistance and if GDX stays near this level for the next couple of weeks it will probably “eat” through the 27.50 resistance and head higher. The chart is not giving a lot of information to act on. The second window down from the top is the weekly RSI which is showing a negative divergence. The second window up from the bottom is the GDX/GLD ratio which is holding above it 12 period moving average and a bullish sign. We are going to remain neutral for now for the short term. The long term picture is on a buy signal. Sold GDX on 6/10/16 at 25.96 = Gain 14.97.
Tim Ord,
Editor
For examples in how "Ord-Volume" works, visit www.ord-oracle.com.
New Book release "The Secret Science of Price and Volume" by Timothy Ord, buy on www.Amazon.com.