
We have been going nowhere for a couple of years. Within that process the emotions of all traders were tested over and over. Many times it appeared that the market was about to break down. Action was terrible on price and their oscillators and that bad action was accompanied by poor economic reports. One after another they came in poorly. Just when all hope seemed lost for the bulls they'd pull some magic trick, also known as fed magic dust. A Qe program here. A bail out there. Low rates forever everywhere kept the markets from breaking down. It was good to be the fed. You needed a bull to keep the economy going through those 401k reports. It didn't work some though because the market couldn't break out. What most failed to understand was that although it didn't break out, it was able to hang tough and not lose critical support. So it was actually working very well even though we weren't seeing a price breakout in equities. The market, it seemed, needed a real catalyst on the positive side of the ledger on the economy. A few days back I wrote I thought the jobs report could be that catalyst. The jobs report came in today as the bulls hoped for and off we went. Blasting higher and closing in on the 2134 all time high SP 500 level. A close above 2134 with force would confirm things and set the market off to a possible parabolic, I have to get in, rise. The bulls are in full control. The bears are against it here. It's now or never for them. If we forcefully get through 2134 the bears are done for and they know it. It appears the one catalyst came true for those bulls and now the market can finally bury the bears once and for all.
 So why has the market been able to break so high on price? The answer is simple. On July 6th the ten year treasury bond hit the lowest reading in history. 1.37%. No one wants to put themselves in that type of instrument. It doesn't work for the long term. Folks want a chance to make some real money and with rates so low on every instrument around the only place to get strong potential returns are in the stock market and thus the fed has accomplished her mission. She knew if she kept rates low the market would rise and eventually break out. If she took away the cookie jars everywhere the children will find the best possible place to play their game. The best place is the stock market and when the stock market is good the economy follows. She may look like she's clueless but nothing could be further from the truth. Her control of the global markets and especially out market has been nothing short of brilliant. She played the game perfectly and now she has gotten exactly what she hoped for. Kudos for her plan and kudos for those who refused to turn bearish even though every technical and fundamental tool said you should be bearish. Fed wins while the bears learn a terrible long term message. NEVER fight the fed.
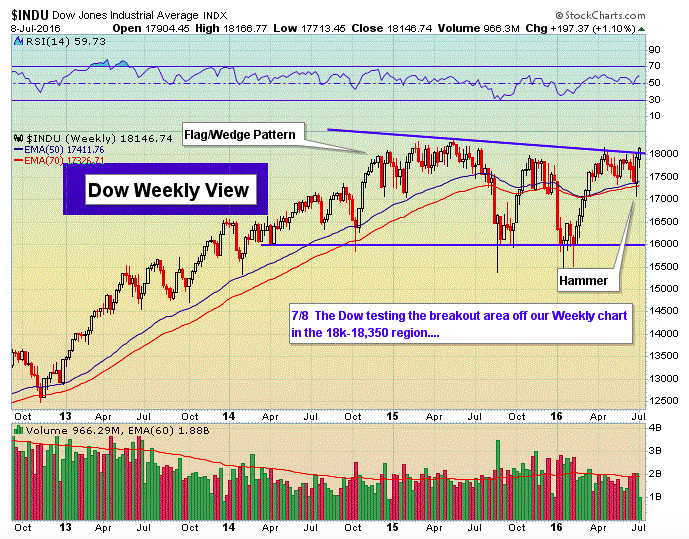
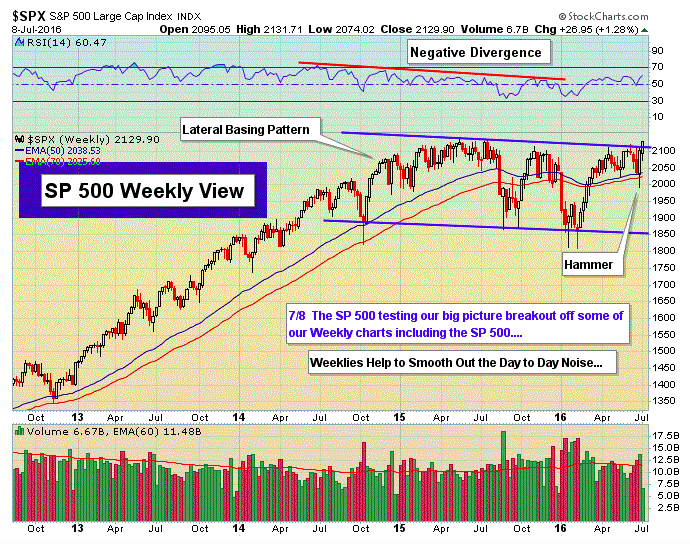
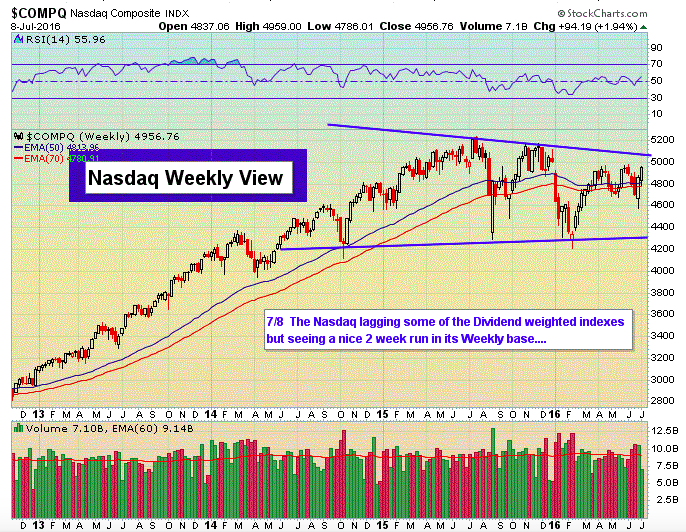
Some of the weekly index charts are now breaking up and out above their trend lines as you can see in this report. Not every one of them as some are up against but there are some key indexes making the move. These are very bullish candles and since this is the end of the week the candles are complete and the bears are staring at a very bad weekend wondering if they will continue their trend next week since technically they should. The bears are in stock market hell when studying these charts. They have to pray for a miracle over the weekend. Maybe overbought short term charts will give them a rest before braking out too far but things don't look good for the bears based on these weekly candlestick closings. The weekly charts sort of smooth out the bigger picture. Yes, the monthly charts are terrible but for now the low rate environment is in charge. Study those charts and you'll see why the bears can't be a happy group. The weekly charts are suggesting much higher levels down the road. Anything can happen of course but the weekly charts are speaking loudly here. Bulls are enjoying the view.
Please join us for a free 3 week trial at www.TheInformedTrader.com
Peace,
Jack Steiman
Robert New