
One of the most difficult chart-reading skills is determining whether a directional change is a reversal or a retracement. During a dynamic trend, the distinction is a key one to recognizing when to exit, or when to hold on.
As a general rule, retracement – a pause in the prevailing trend during which price moves in the opposite direction – is recognized by the lack of any reversal signals. A true reversal should be easily identified with specific reversal indicators and confirmation.
Even so, these general rules are not guaranteed to work in all situations.
One signal that helps make the distinction is the continuation candlestick. Little time is devoted to this type of signal because most traders are focused on finding and anticipating reversal. However, once you are in a trend, continuation signals are valuable in revealing when a turn in direction is only a retracement.
For example, on the chart of Exxon Mobil (XOM), very clear and strong continuation signals precede retracement and reveal that the bullish trend will continue.
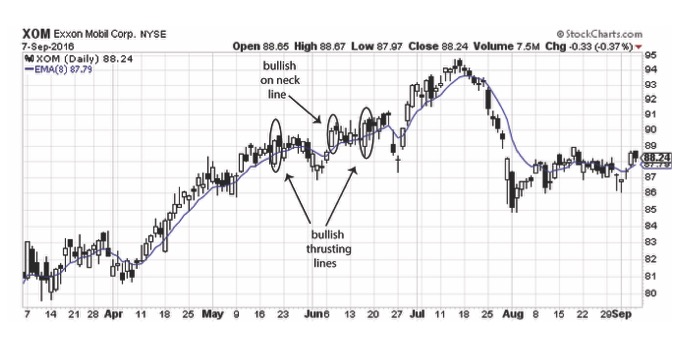 The first of these continuation signals is a bullish thrusting lines, occurring in the third week of May. This provides confidence that the uptrend that began in the first week of April will continue. Even so, at the end of May and beginning of June, price turned downward. Five consecutive sessions moved price from about $89.75 down to $87.50. However, at the same time, there were no reversal signals or confirmation. This confirmed what the thrusting lines predicted – that the bull trend would continue.
A second continuation signal appeared as price recovered from the retracement. The bullish on neck line confirmed that the bullish move had resumed and would continue.
A third continuation occurred in the third week of June. This second bullish thrusting lines forecast bullish continuation following about two weeks of relatively weak advances in price. Even so, this should have reassured traders that the bull trend was not over.
Near the end of June, a large downside gap and three days of price decline occurred. This was neither a reversal nor a retracement, but market over-reaction to the Brexit vote. The thrusting lines promised more price advance, and this did occur rapidly from the end of June through to mid-July.
This analysis reveals the true value of the continuation signal. It may occur before or after retracement, but given the lack of reversal signals, it accurately forecasts that the retracement is temporary.
Another form of confirmation for both the trend continuation and the temporary nature of a retracement is the t-line, marked as a solid line following price on the chart. This is an 8-day exponential moving average of price. The technical rule of the t-line is that when price closes above the line in repetitive sessions, the signal is bearish. When it closes below, the indication is bearish.
However, in retracement, price moves below but quickly returns to close above the t-line. During the overall bull trend, the price traded above the t-line consistently until the trend ended. At that point, price began trading below the t-line. The crucial observation here is that the dip below the t-line occurring at retracement did not endure. Price immediately moved above to resume its bullish movement.
This is an example of how several technical signals and price patterns work to confirm one another. The retracement (with its lack of reversal signals), the candlestick continuation signal, and the t-line all work together to reveal not only that the trend is continuing, but also when it is likely to end.
Michael Thomsett blogs at TheStreet.com, Seeking Alpha, and several other sites. He has been trading options for 35 years and has published books with Palgrave Macmillan, Wiley, FT Press and Amacom, among others. He is the author of Investing in Energy. You can find this book at Amazon.com and Barnes and Noble