
 While the upcoming election is holding everyone’s attention, it is appropriate to look at what might lie beyond. One important point to note is that there is a difference in the market’s behavior depending on whether the incumbent party wins, or whether the new challenger party candidate wins.
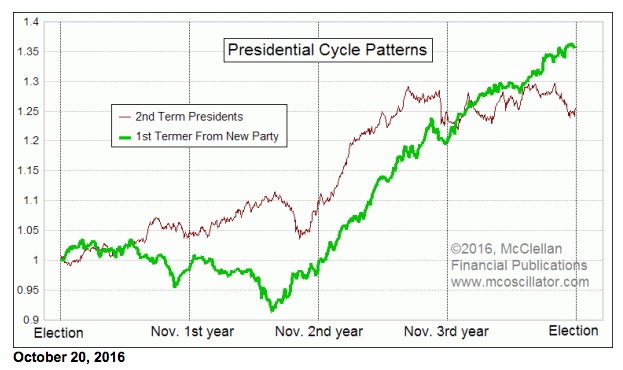
The chart above shows two different versions of our Presidential Cycle Pattern, based on which type of president is in office. I don’t mean which party, but rather the differentiation is over whether the president is from a different party than the last term. For those rare instances when the same party is in office for a 3rd term (e.g. Truman, or Bush 41), I count that as a 2nd term president.
The reason for differentiating this way is that when a new president from a different party takes office, historically they have spent the first couple of years “discovering” that conditions are even worse than he told us during the campaign, and that the “only solution” is whatever package of taxes, spending, or regulatory changes it is that he is proposing.
For President Clinton in 1993, that took the form of declaring that we were in the “worst recession in 50 years” (despite 5% GDP growth), and that the solution was his $20 billion package of pork-barrel spending. Ha! $20 billion… what a cute little number.
For Bush 43 in 2001, it was a round of income tax rate reductions, followed by another one starting in 2003 that finally worked to get the stock market and the economy growing again. For President Obama in 2009, it was $800 billion for “shovel ready projects”, and of course the Affordable Care Act.
During those first 2 years, when the new president is declaring that things are even worse than we all thought, investors tend to get depressed by hearing the negative self-talk, and stock prices tend to underperform. But when the winner of the election is the same president, or from the same party, historically they have not spent as much time blaming the predecessor and saying that everything is bad.
So the point is that during the first two years of a presidential term, there is on average a big difference between a new party taking over versus the incumbent party retaining control. That difference tends to go away, on average, by the end of the 3rd year.
And election years are different when the incumbent is not running for reelection, as is the case right now. Investors face the certainty of getting an unknown, and investors don’t like unknown risks. So the market does worse in election years with no incumbent running.
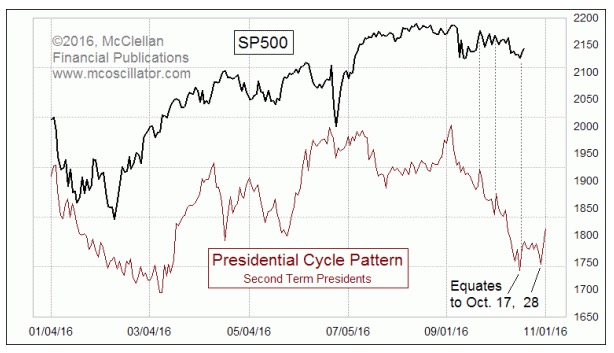
The SP500 in 2016 is following the dance steps of that 2nd term Presidential Cycle Pattern really well. We are not seeing the magnitude of a decline that it suggests, but the movements are in sync. We got the bottom Oct. 17 right on schedule, and there is another one due a few days ahead.
Tom McClellan
The McClellan Market Report
www.mcoscillator.com