In my last post, I mentioned a retail stock that looked to have some nice upside potential. The company was Five Below (FIVE) and the stock appeared to be reversing a 3 ½ month downtrend after being down 34% from its high in price.
While my research generally leads me to stocks closer to hitting new highs, FIVE caught my eye because its moving averages were signaling a buy point. I was also familiar with the stock from a fundamental standpoint and the company was in a growth mode but had sold off with other consumer stocks which had been out of favor with investors.
Several positive moving average signals were flashing when I discussed FIVE two weeks ago and I’ll review them in order of how one would screen for stocks that are potentially bottoming. As always, you’ll want to combine moving average signals with other positive technical indicators to strengthen your case for entering a trade.
Let’s start at the beginning. Your first screening criteria in searching for turnaround stocks would be looking for stocks that are at least 30% from their 1 year high in price. You can certainly make the decline less as the steps below will still apply however, I’ve found 30% or more to be most fruitful.
From there, you want to make sure that the downtrend in these stocks is ending and that the stock is beginning to reverse. Your 1st criteria for that will be looking for the stock to be breaking up above its 10 day moving average on volume.
In my experience, despite breaking above its 10 day moving average, it’s not quite time to buy yet. The stock is now heading for its next possible area of resistance and that is its 50 day moving average. This 50 day moving average will be in a downtrend and it can be a formidable barrier to further upside. For now, the stock is on your watch list.
Within this watch list, the next positive action you need to see is the stock breaking above its 50 day moving average and again – on volume. This move will help level out the 50 day moving average and position the MAV line so it can move upward in a healthy fashion. As for the volume, you’ll need to see it with these last 2 steps because it will indicate institutional money which will give the stock the push it needs to go higher.
Once these criteria are met and you are comfortable with the fundamental aspects of the company, you may begin taking a position in the stock. With an up-trending market as your backdrop, this can be a very successful strategy for identifying stocks that are reversing their downtrend.
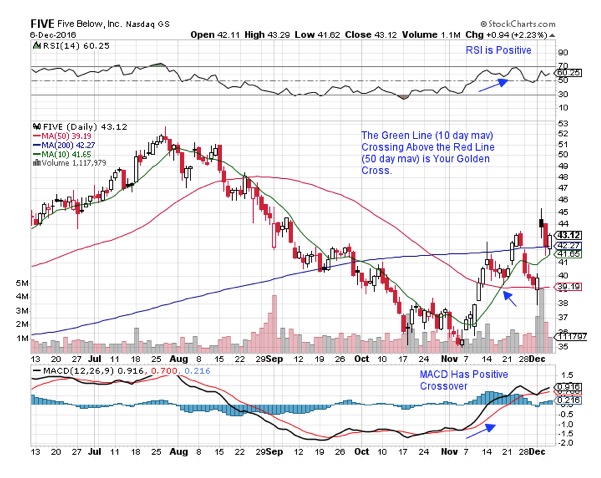
For my work however, I like to see a 3rd event take place which will provide even more confidence that the downtrend has reversed. That next action is the 10 day moving average crossing above its 50 day moving average in what’s called a golden cross. The definition of a golden cross is when a stock’s shorter term moving average crosses above its next lengthy moving average (i.e. 10 crossing above 50 or 50 crossing above 200 day moving average.)
Once all of these steps have taken place, the stock should be on its way higher. However, as everyone knows, stock action is not that predictable. As you can see with FIVE, the stock dropped back below its 10 day moving average which could be concerning. However, the decline was on very light volume and more importantly, it found support at its longer-term 50 day moving average which was no longer in a downtrend.
FIVE went on to gap-up in response to a positive earnings report and the stock is now finding support at its upward trending 10 day moving average. This is a positive and points to a stock that is poised to go higher. That said, the markets can be volatile so as with all of your positions, you’ll want to place stops in the event the reversal fails.
Mary Ellen McGonagle
MEM Investment Research
www.memInvestmentresearch.com
DAILY CHART OF FIVE BELOW (FIVE)
Notice Volume Bars at Bottom Relative to Price Action