This time of year, there is no escaping discussion of the “Sell in May and Go Away” phenomenon. That is, the idea that equity markets tend to be seasonally weak in the May-October period, then stronger in the November-April period. You can find more on the history of the phenomenon here.
Here are three things to keep in mind as you consider the “Sell in May” concept:
Even if everyone knows about it, it could still work.
Over the years I have been asked this question many times about many technical indicators: “Does it work because people look at it, or do people look at it because it works?” The question of whether any indicator is a self-fulfilling prophecy is actually quite difficult to prove or disprove. If enough people take advantage of the Sell in May phenomenon (assuming the markets are driven by supply and demand, often fueled by fear and greed), then that selling activity would actually create the supply that would provide a drop in prices.
The reality is that there are millions of investors out there making investment decisions based on many different inputs, using many different time horizons and many different execution strategies. It’s highly unlikely that one technical indicator or strategy would be such a widespread self-fulfilling prophecy to the point that it would somehow lose its effectiveness as a result.
So just because people are aware of a pattern existing shouldn’t really make it any less meaningful. Even if you study behavioral finance and learn every bias that you may fall victim to, you’ll find you’re still tempted by these instinctual reactions when you go to make a trade. As enlightened of an investor as you may be, you’ll still start sweating when you see lots of red on your monitors!
This is one market cycle among many.
Remember that at any one point, there are many cycles at play- the Presidential Cycle, the ten-year cycle, and even long-term cycles such as Kondratieff waves. Mark Hulbert addressed this recently, suggesting that the Sell in May effect was mainly attributable to the four-year cycle.
So you have to weigh the importance of the May-October pattern along with all of the other cycles that may be at a key juncture. I have seen a number of analysts put together “composite cycles” that combine these different cyclical patterns into one “master analog” for the year- however, I’ve always preferred to simply be aware of cycles, but to follow price (see below).
Another consideration is the feedback mechanism that is built into the markets. Stocks tend to trend, and there is more and more academic research to support this phenomenon (often labeled as “momentum” or “relative strength”). So whether or not a certain cycle comes due, markets tend to trend because investors tend to chase strength and avoid weakness. The four-year cycle is a great example of this phenomenon.
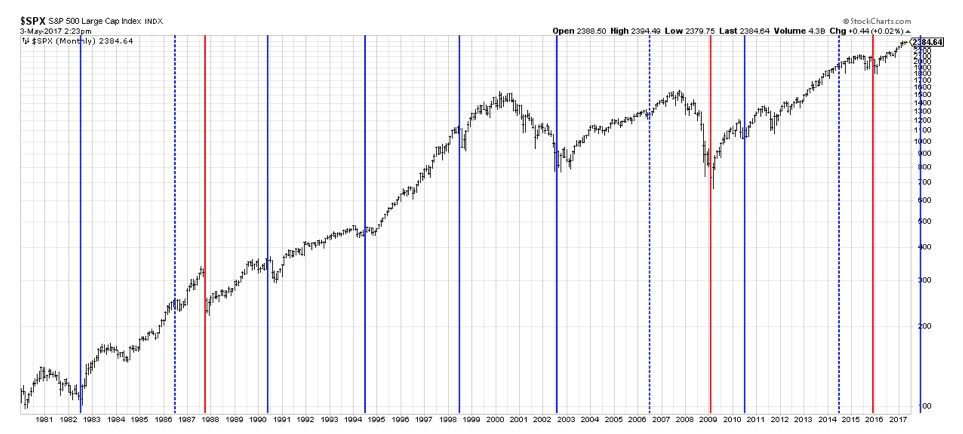 S&P 500 index, monthly data Source: stockcharts.com
In the above chart, solid blue lines indicate the midpoint of every four years going back to the 1982 low. The dotted blue lines show where the market did not bottom when predicted by the cycle. In each case, the “delay” of this cycle led to more significant corrections (1987 and 2009). The third and most recent time (2014) suggests that the 2016 low was more of a significant cyclical low than appears on the chart. In fact, many global markets had more significant price corrections around this time.
So in many cases, the momentum behind the market may be enough to continue the trend well past the point where a cycle may indicate a pause.
The markets are a complex system.
We also have to remember that cycles don’t happen in a vacuum. There are many influencers on the supply and demand that comprise the market. Bob Prechter speaks very well on the myths of exogenous causes and rational reaction in his latest book. To summarize, we love to simplify the financial markets into simple cause and effect relationships. For example, “stocks go up when gold goes down.” In reality, it seems that for every example where this is the case, you can find another where that relationship is completely flipped. The reason? The stock market is a complex system, and as much we’d like to simplify price gyrations into simple cause-effect relationships, there are many different factors that effect market movements at any time.
The financial industry is bursting with quick one-liners to illuminate market truisms…
Sell in May and Go Away…
The Trend is Your Friend…
If Santa Claus should fail to call, bears may come to Broad and Wall…
As humans, we love to boil complex ideas down to simple, memorizable quips as it helps us make sense of the complex world we live in. The reality is that the three catchy sayings above are indeed based on market history and have stood the test of time. The real question is how to weigh their importance relative to the rest of your analysis.
So what does this mean for the markets now?
As stated above, things like seasonal cyclical patterns certainly have a place in the toolkit, but the most important technical input should be price itself. I recently quoted legendary technical analyst Paul Montgomery who said, “The most bullish thing the market can do is go up.”
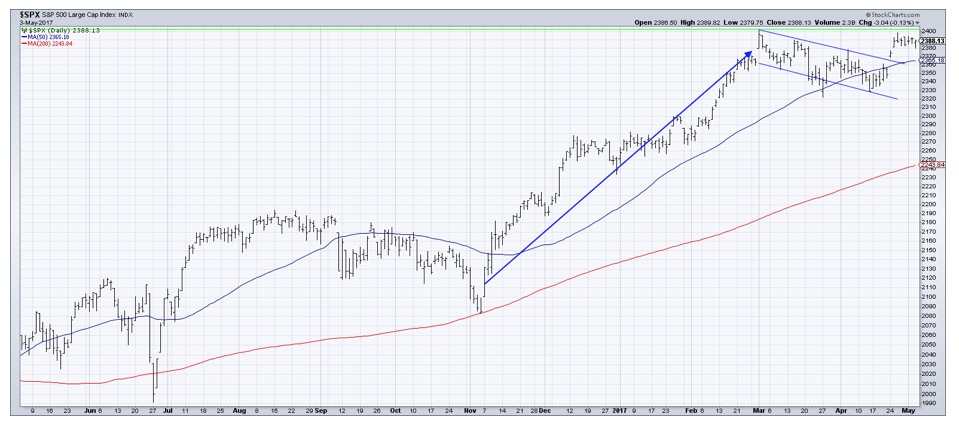 S&P 500 index, daily data Source: stockcharts.com
Until we see some sort of price weakness, a bull flag and upside resolution suggest the weight of the evidence remains positive. Up and to the right is bullish!
David Keller, CMT
marketmisbehavior.com
David Keller, CMT is passionate about viewing the markets through the lenses of behavioral psychology and technical analysis. He is a Past President of the Market Technicians Association and currently serves as a Subject Matter Expert for Behavioral Finance. David was formerly a Managing Director of Research at a large buyside institution as well as a technical analysis specialist for Bloomberg. You can follow his thinking at marketmisbehavior.com.
