Top Advisors Corner February 22, 2018 at 10:15 AM
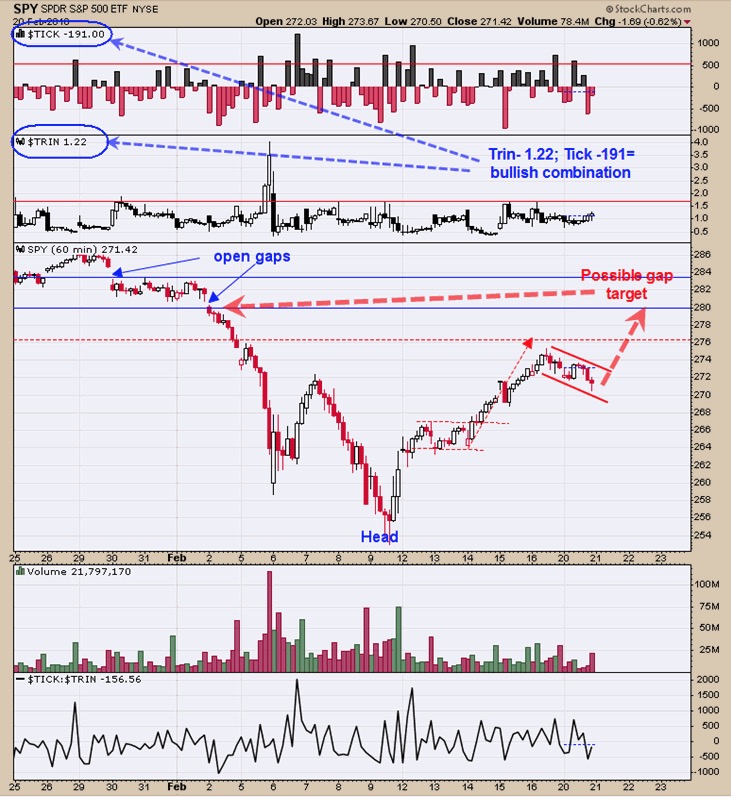
SPX Monitoring purposes; Long SPX on 2/20/18 at 2716.26. Monitoring purposes GOLD: Neutral. Long Term Trend SPX monitor purposes: Long SPX on 2/8/18 at 2581.00. The above is a 60 minute chart of the SPY... Read More
Top Advisors Corner February 21, 2018 at 04:45 PM
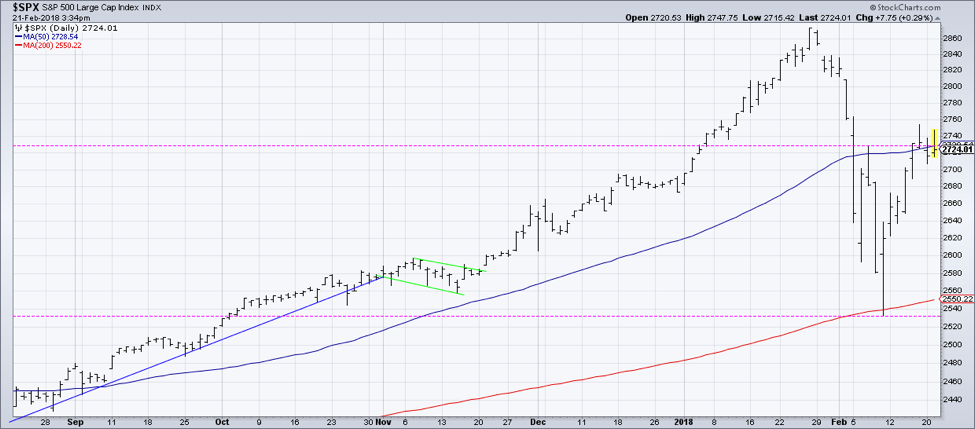
As the S&P 500 teases the upper end of the 2530-2750 range, the S&P sector charts are providing some clarity on market leadership. Even with all of the recent volatility, the S&P 500 has remained neatly between its 50-day and 200-day moving averages... Read More
Top Advisors Corner February 15, 2018 at 12:32 PM
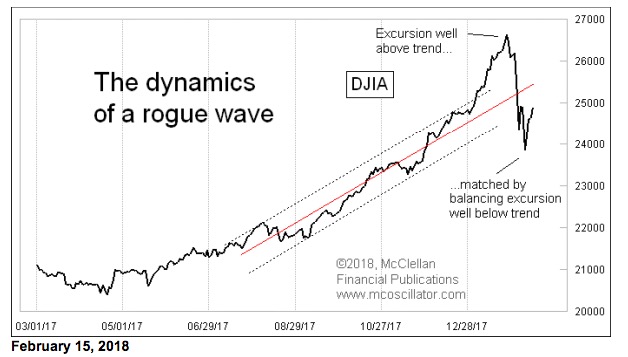
The stock market is just coming out of a big rogue wave event. And that gives us clues about what lies ahead. The term "rogue wave" gets used in other areas of science, most notably in analysis of big waves in the ocean... Read More
Top Advisors Corner February 09, 2018 at 11:15 AM
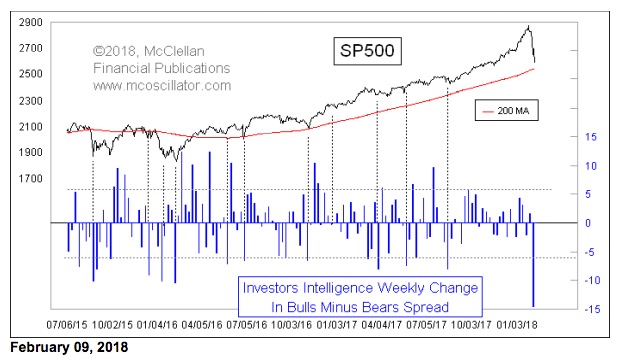
The latest data from Investors Intelligence showed a huge change this week. Bulls dropped from 66% to 54.4%, and bears rose from 12.6% to 15.5%. That means the spread between bulls and bears dropped by 14.5 percentage points, which is the biggest one-week drop since July 2011... Read More
Top Advisors Corner February 06, 2018 at 02:36 PM
In our last submission, I said that in a nutshell, everything looked great, with the trend up, the market making new highs, improved growth, and Market Breadth very strong... Read More
Top Advisors Corner February 06, 2018 at 08:57 AM
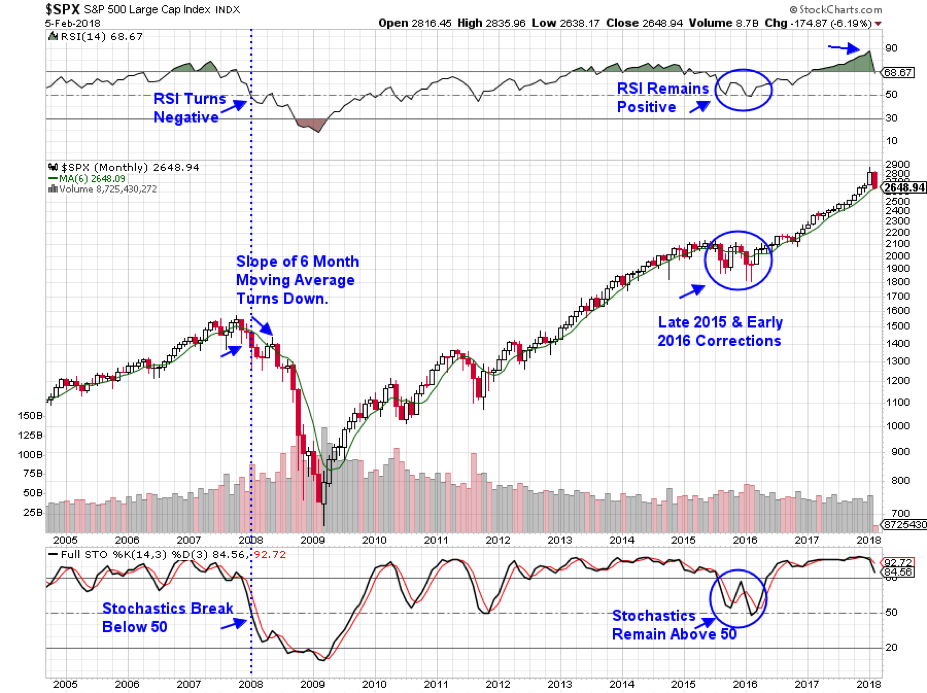
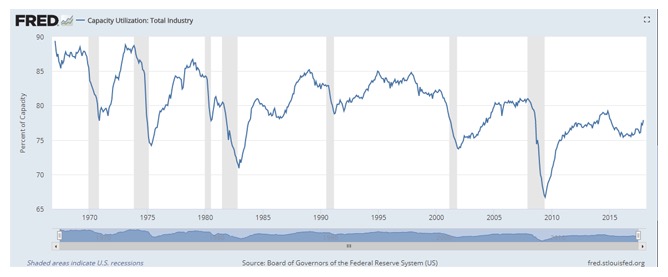
“Using Longer Term Charts Along With Certain Indicators Will Provide Insight and Perspective... Read More
Top Advisors Corner February 06, 2018 at 08:24 AM
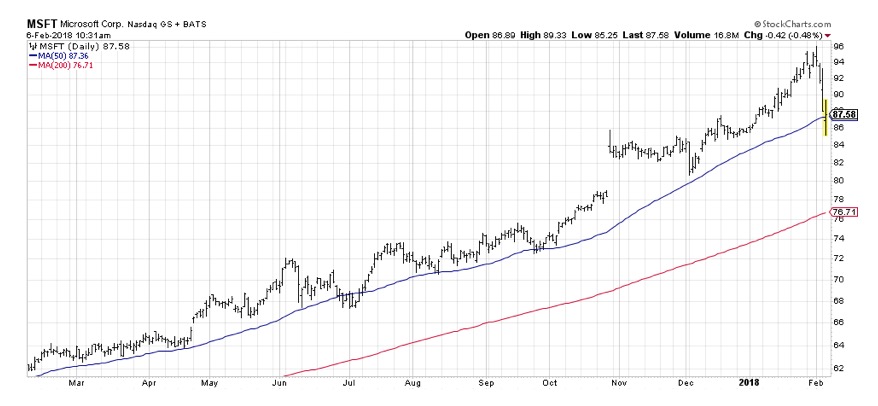
Last week, I watched the S&P 500 become overbought on both the weekly and daily charts. I also noticed stocks like Visa (V) display bearish engulfing patterns, suggesting a correction was imminent. The next thing I did was add a “Correction Watch” page to my stockcharts... Read More
Top Advisors Corner February 05, 2018 at 09:33 AM
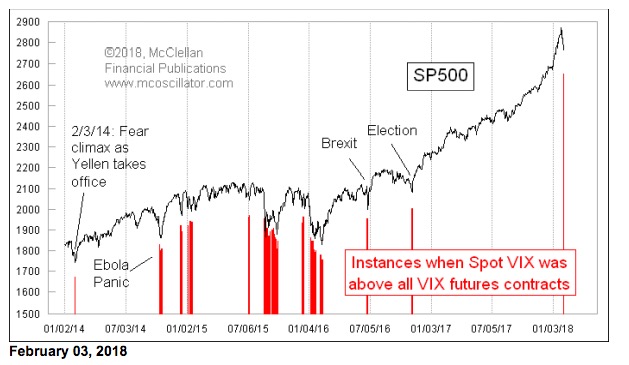
The scary selloff on Friday, Feb. 2 took price indicators down to oversold readings, and it took the VIX up to its highest reading since the November 2016 election. In the process, it also rose up above the price of all of its futures contracts... Read More