I show the 200-day moving average on about 90% of my charts. I do so not because of its incredible predictive power, but more because it tells me the overall trend. By smoothing out 200 days of closing prices, I can minimize the noise of the daily volatility and focus on the long-term trends.
A brief review of the 200-day moving averages shows that while the S&P 500 has remained above this long-term barometer, many stocks and sectors have already broken down.
The S&P 500 index tested its 200-day moving average in early February during the first downward thrust of the correction. After rebounding to 2800, the index fell once again and now sits right on the 200-day.
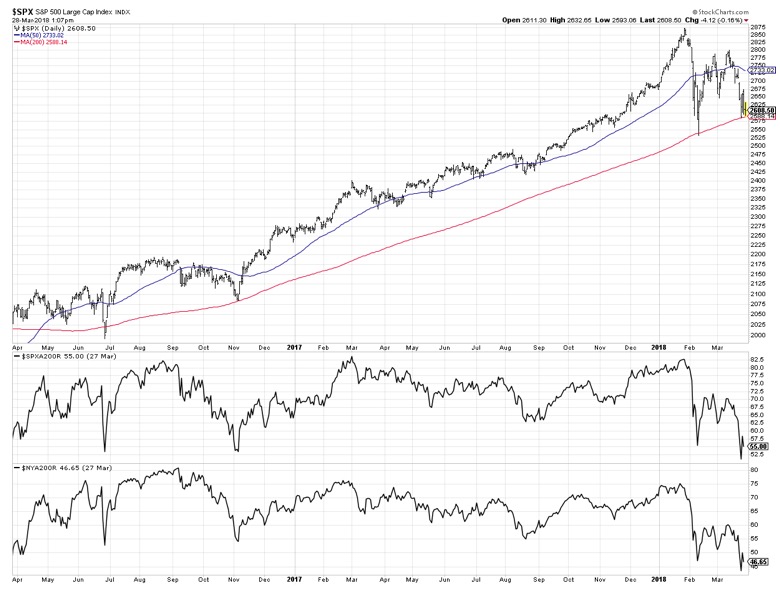 Needless to say, if we see a confirmed break below the 200-day moving average, that would suggest a deeper correction in subsequent weeks. A quick review of breadth indicators shows that many stocks have already broken down.
Above we see the S&P 500 index along with the percent of S&P 500 stocks above their 200-day moving average. The bottom panel shows the percent of NYSE names (a much broader universe) above their 200-day moving average.
This shows that even though the S&P 500 index has not yet broken down, 45% of S&P 500 names and 53% of NYSE names are already trading below this long-term trend barometer. So while the broad market index remains above, many stocks have already traded lower.
Now let’s look at a deeper history of this key breadth measure.
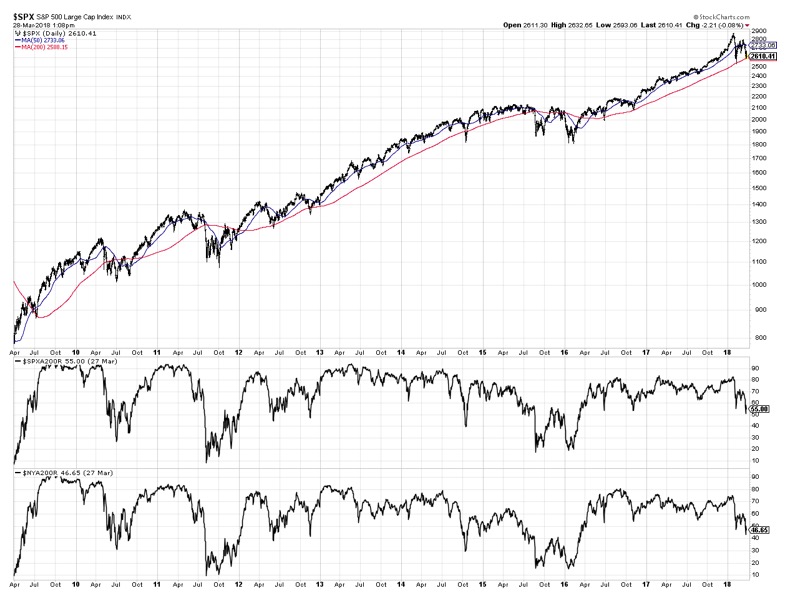
Now we can see how the current breadth readings compare to the levels seen in previous market corrections.
The last two major corrections were in late 2016 and summer/fall of 2011. In both cases, we got down to 20% of S&P names remaining above the 200-day moving average. Now the current reading of 55% seems way higher than what might be expected in a corrective period.
What about the 11 S&P sectors?
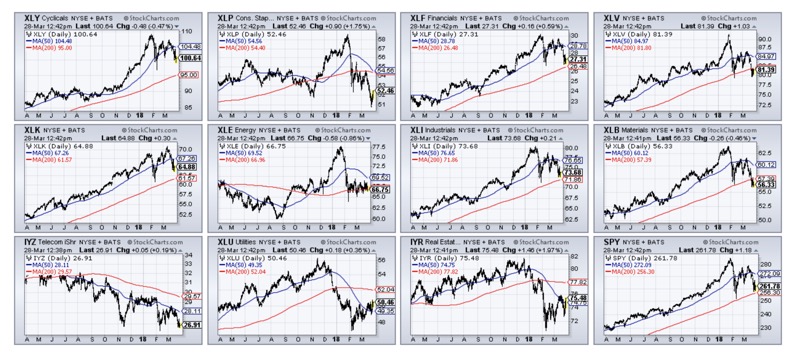
Only four of the 11 S&P sectors are currently above their 200-day moving average: Consumer Discretionary, Financials, Technology, and Industrials. This list represents four of the five largest sectors in the S&P, which explains why the index itself remains in a positive trend.
Financials, Technology and Industrials are all very close to the 200-day. If we see a break lower in those three sectors, that could be the signal of a much deeper and drawn out market correction.
David Keller, CMT
President
Sierra Alpha Research LLC
David Keller, CMT is President of Sierra Alpha Research LLC, a boutique investment research firm focused on managing risk through market awareness. He is a Past President of the Chartered Market Technicians Association and most recently served as a Subject Matter Expert for Behavioral Finance. David was formerly a Managing Director of Research at Fidelity Investments in Boston as well as a technical analysis specialist for Bloomberg in New York. You can follow his thinking at marketmisbehavior.com.
Disclaimer: This blog is for educational purposes only and should not be construed as financial advice. The ideas and strategies should never be used without first assessing your own personal and financial situation, or without consulting a financial professional.
