
SPX Monitoring purposes;
Sold SPX 7/24/18 & 2820.40= gain .57%;
Long SPX 7/19/18 & 2804.49.
Monitoring purposes GOLD: Neutral.
Long Term Trend SPX monitor purposes;
Sold long term SPX 7/16/18 at 2798.43= gain 2.95%;
Long 6/29/18 at 2718.37.
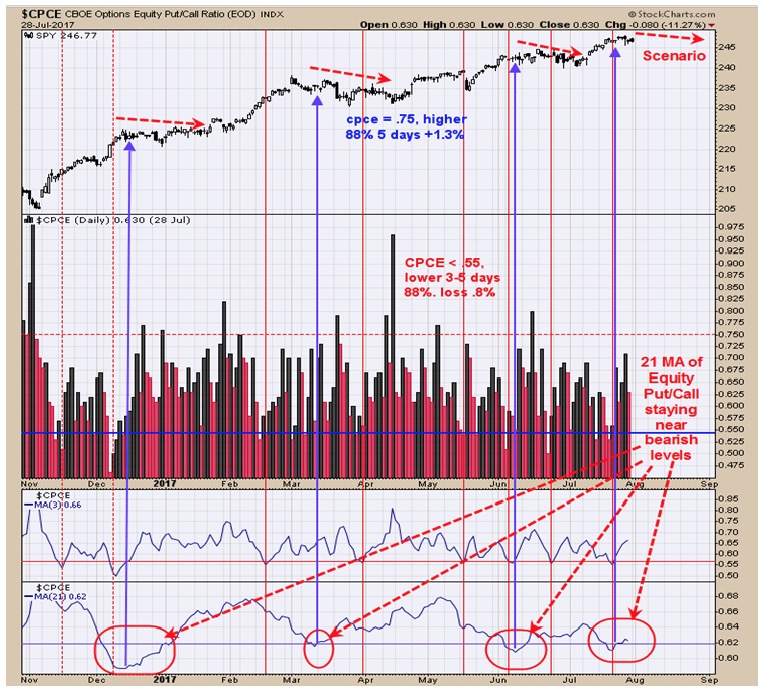 FOMC meeting is today and tomorrow and can have an affect on the markets. Monday’s Total Put/Call ratio came in at 1.12 and at its upper Bollinger band which have marked short term lows in the markets. The top window is the McClellan Oscillator which has remained below “0” over the last couple of weeks which is a bearish sign. Market could bounce to last Wednesday high and find resistance. Neutral for now. Sold long SPX on 7/24/18 at 2820.40= gain .57%; Long SPX on 7/19/18 at 2804.49.
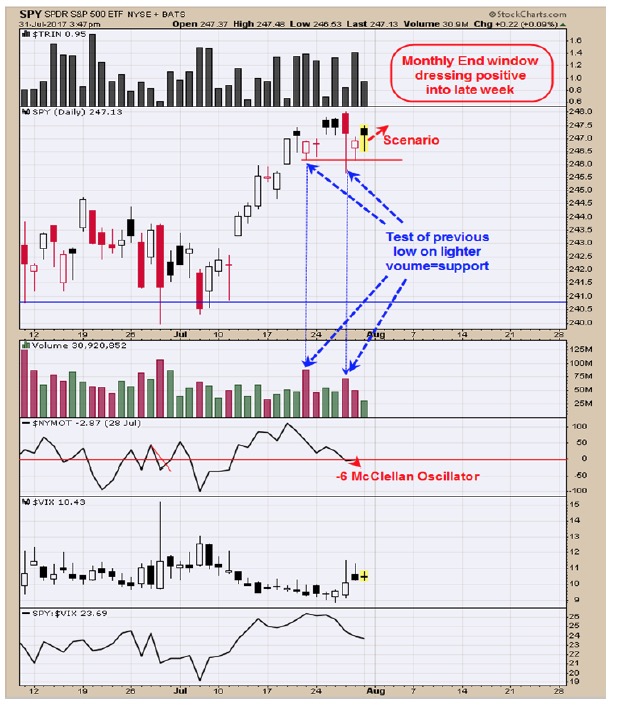 Last Wednesday SPY broke to new recent high on increased volume, suggesting that high may be tested again as most high volume highs are tested. Last Friday’s decline tested the gap of July 24 on increased volume suggesting the gap will not be a support area and a bearish sign. Today the SPY tested yesterday’s high on increased volume, suggesting the short term bounce may continue and may attempt to test last Wednesday’s high. The pattern that may be forming since May is a “Three Drives to Top” and the Third top is completing now. This pattern has a downside target near where the pattern began which in this case is near the 268 range on the SPY. FOMC meeting is tomorrow and if market bounces into this timeframe could produce a setup for a sell signal. Neutral for now.
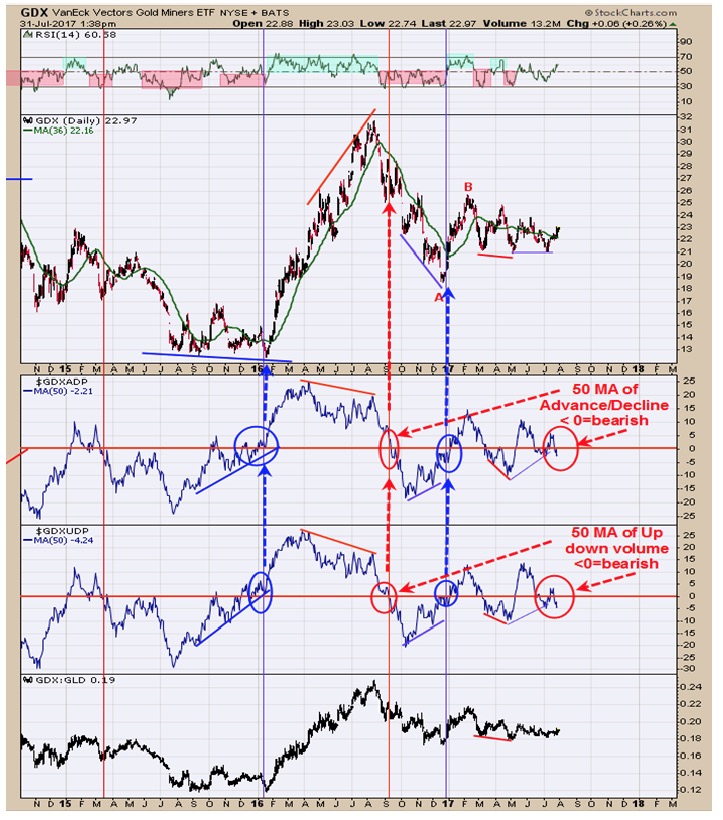 As we said yesterday, “Momentum needs to turn back up to get the picture back to bullish”. This chart shows several momentum indicators and a couple of them are showing bullish divergences. The top window is the RSI for GDX and a close above 50 will be a bullish sign (today’s close is 40.82. Next window down is the Cumulative Up Down volume which made a higher close low as GDX made a lower low and a positive sign. ). Next window down is GDX which drew a bullish candlestick pattern called a “Bullish Engulfing”. Next window down is the Cumulative Advance/Decline which also made a higher low as GDX made a lower low and a bullish sign. Bottom window is the GDX/GLD ratio which is bullish when this ratio is rising and at the moment is still declining. Gold commercials short position on the last report updated last Friday closed at 66K and the least short position going back to the December 2015 bottom. Major lows have formed in Gold when the Commercial position has been less than 100K. Market is still pounding out a low here but momentum needs to turn back up to get us long again.
Tim Ord,
Editor
Visit www.ord-oracle.com. New Book release "The Secret Science of Price and Volume" by Timothy Ord, buy on www.Amazon.com.