SPX Monitoring purposes; Long SPX on 10/22/18 at 2755.88.
Monitoring purposes GOLD: Sold 11/27/18 at 18.88=gain .075%; Long GDX at 18.72 on 8/17/18
Long Term Trend SPX monitor purposes; Long SPX on 10-19-18 at 2767.78

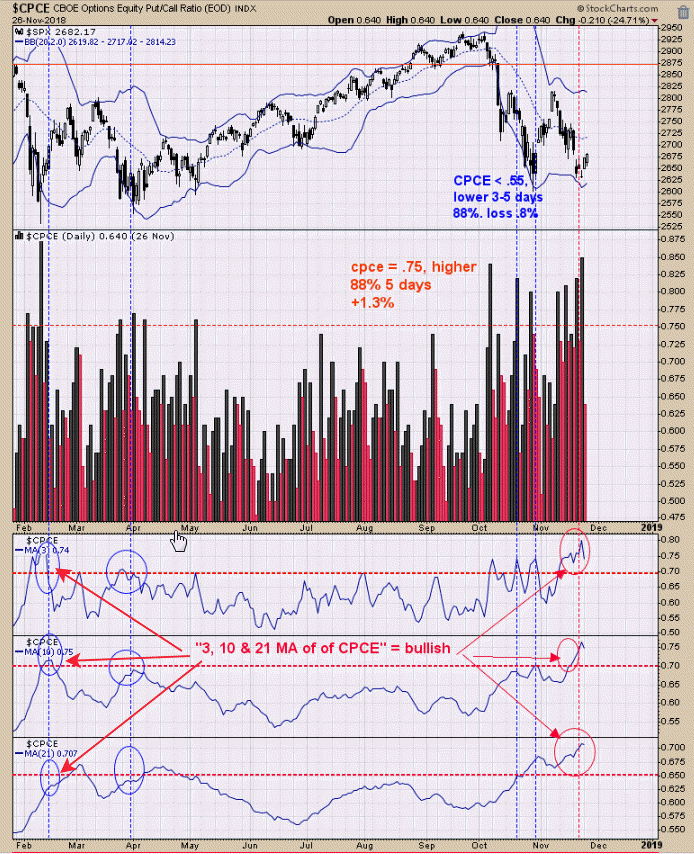
We looked at the 3, 10, 21 day moving average of the Equity Put/Call ratio several days ago. The chart has been updated to yesterday’s close. There are a lot of equity puts the public is holding and, previously, when they have been loaded up in Puts on the 3, 10, and 21 day periods the market was near an intermediate term low. The last time they (public) were near this level came back at the February low.

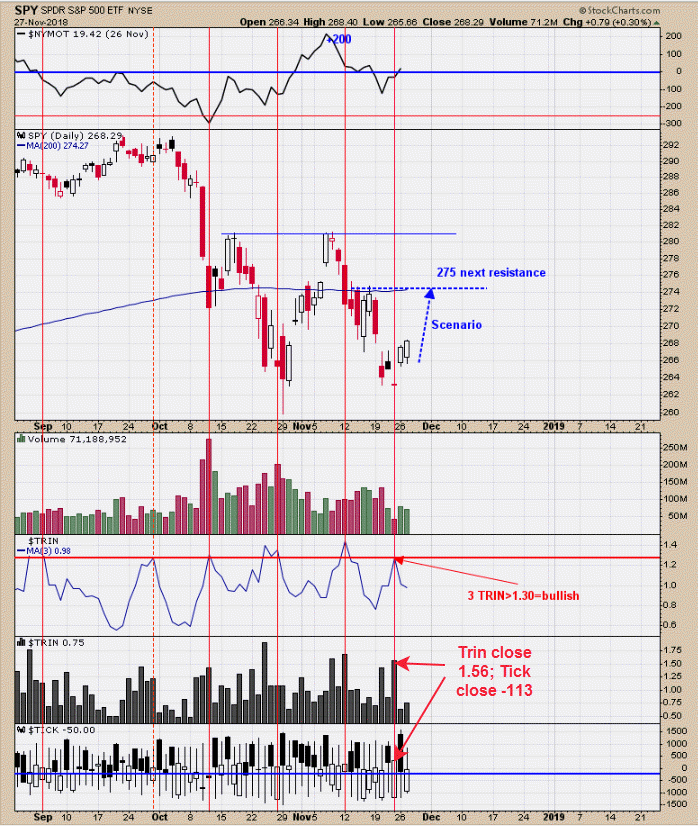
Last Friday the TRIN closed at 1.56 and the Ticks at -113, which predicts a low in the market between the same day as the reading to as late as two days later. It now appears that a bottom formed last Friday. Also, the 3-day TRIN reached the bullish level of 1.30 last Friday, adding to the bullish setup. The next upside resistance is the high of mid-November near the 275 range on the SPY (2750 SPX). SPY could stall at the 275 range for three to four days (as that is the number of days it stalled at the mid November period) before heading up to the next resistance level, which is the 282 SPY range. It is still possible that SPY may test the September highs (295 SPY range) in December or January. From the report on Monday two weeks ago, “Since 1950 the change from October low through year-end average=10.7% gain (with no losses) during mid term elections years (@theonedave). The 10.7% average from the October low would give a target near 289 on the SPY (2890 SPX).”

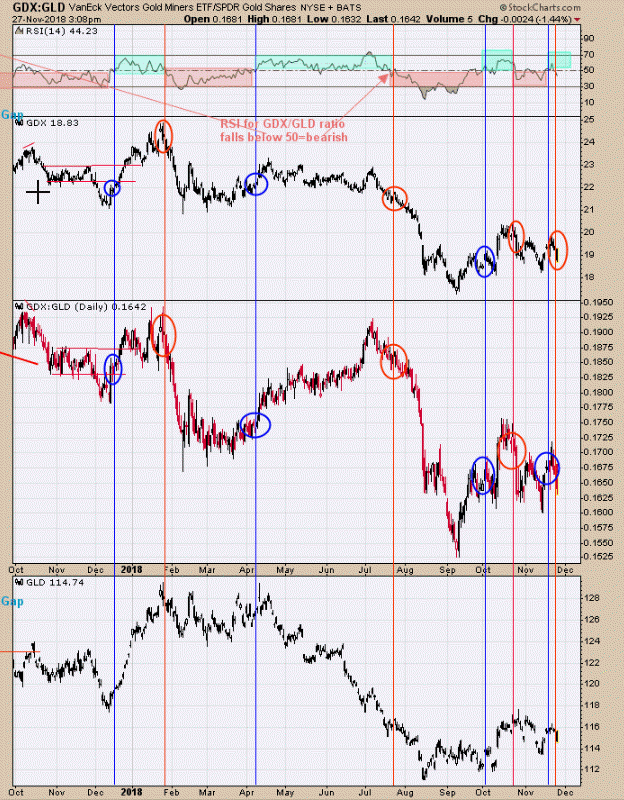
We have plotted vertical blue and red lines where the RSI of the GDX/GLD ratio RSI passes above and below the 50 level, showing buy and sell signals. Right now, the RSI for the GDX/GLD ratio stands at 44.23, which is bearish short term. There have been back and forth signals since the September low and it still appears to be in the back and forth scenario. The Gold Commercials are short at 23K, up from short 1823 contracts last week and still in bullish territory (but less bullish than the week before). Commercials shorts less than 50K have marked significant lows in the past. GDX and Gold appear to be in a bottoming pattern, but that bottoming pattern is incomplete and another test of the lows is possible in the coming days. We sold our long GDX position today (11/27/18) at 18.88 for a .075% gain; Long GDX at 18.72 on 8/17/18. We will wait for the next bullish setup.
Tim Ord,
Editor
www.ord-oracle.com. New Book release "The Secret Science of Price and Volume" by Timothy Ord, buy at www.Amazon.com.
