SPX Monitoring purposes; Long SPX on 10/22/18 at 2755.88.
Monitoring purposes GOLD: sold 11/27/18 at 18.88=gain .075%; Long GDX at 18.72 on 8/17/18
Long Term Trend SPX monitor purposes; Long SPX on 10-19-18 at 2767.78

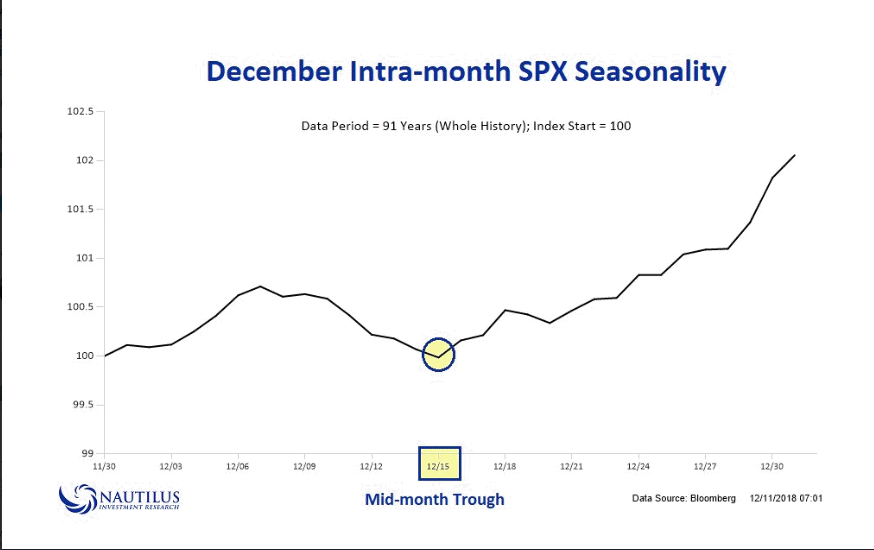
The above chart is from Nautilus Investment Research. It is a seasonality chart for the month of December, going back 91 years. The low for December according to this Seasonality chart is expected on the 15th, which is Saturday. The FOMC meeting occurs on December 18 and 19, next Tuesday and Wednesday. It appears the market is settling at a low, but may not come off this low until the FOMC meetings. Just food for thought. Putting it another way, if the market is near this level going into the FOMC meeting, then the catalysis for the rally could be the FOMC meeting.
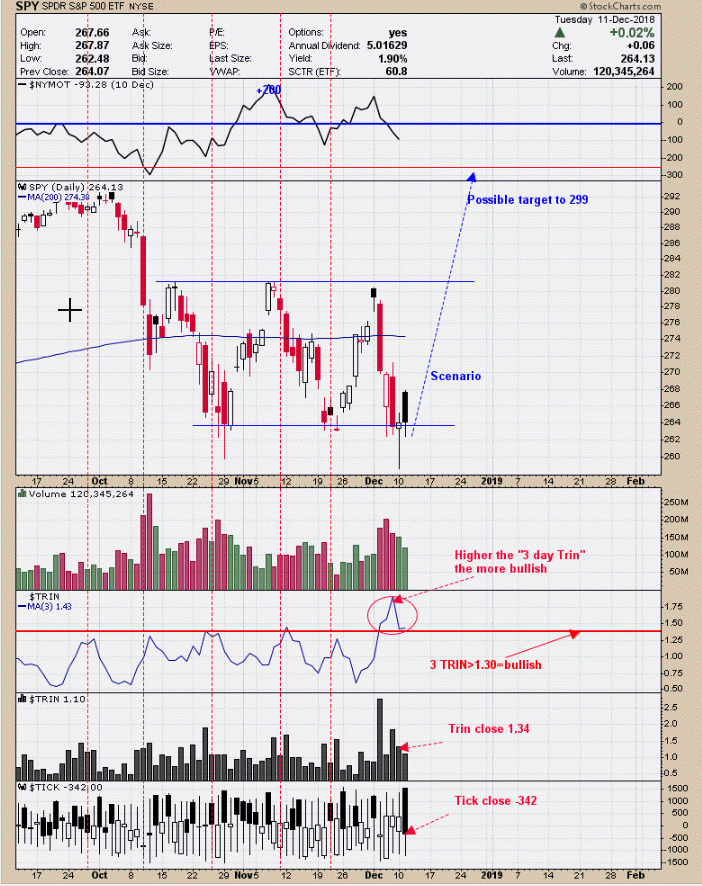
 The 3-day TRIN reached over 1.75 last Friday and a bullish sign. The last time the “3 day TRIN” came near 1.75 was at the February low. Today the Tick closed at -342 and yesterday the TRIN closed at 1.34, which is a bullish combination that shows panic is present and market bottoms on panic. If the markets sits here for the next couple of days, it may wait until the FOMC meet as a catalysis for the next rally to start. Whether the rally starts now or at FOMC meeting, the sentiment probabilities point bullish. From four weeks ago “Since 1950 the change from October low through year-end average=10.7% gain (with no losses) during mid term elections years (@theonedave). The 10.7% average from the October low would give a target near 289 on the SPY (2890 SPX).”
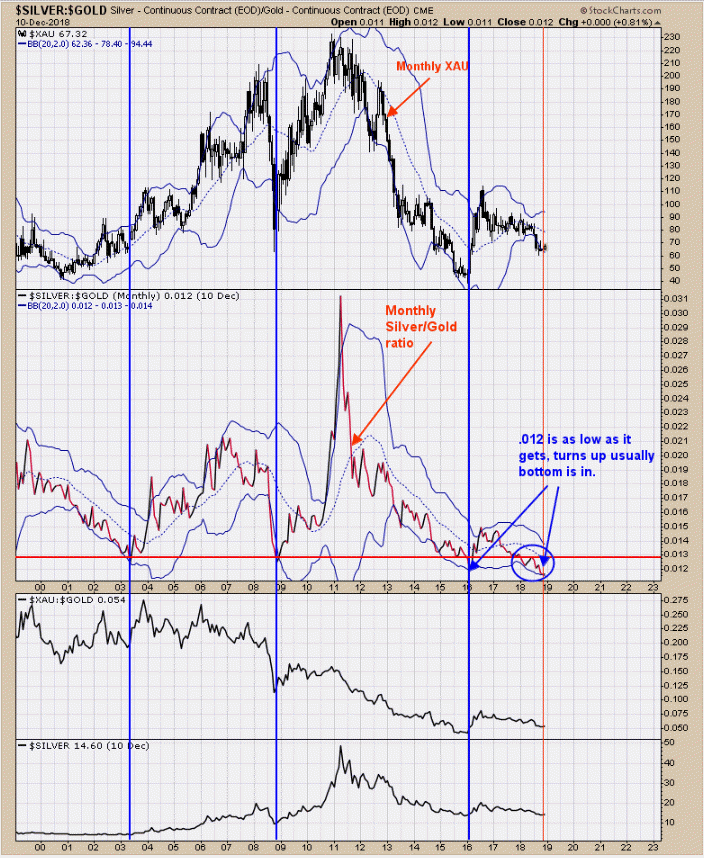
 We have a longer-term cycle low due early next year and it's starting to look like it could come in January (not far away). We have shown this chart in the past and have updated to yesterday’s close. It's worth keeping an eye on this chart as it depicts a bullish larger scenario. The above chart is the monthly Silver/Gold ratio going back to late 1999. Longer term bullish bottoms have formed (both for Gold and Gold stocks) when the Silver/Gold ratio dropped below .013 (current reading is below .012). The Silver/Gold ratio has generally been below .013 for nearly one year, which in our view suggests a lasting rally in gold and gold stocks is forthcoming. We sold our long GDX position (11/27/18) at 18.88 for a .075% gain; Long GDX at 18.72 on 8/17/18. We will wait for the next bullish setup.
Tim Ord,
Editor
www.ord-oracle.com. New Book release "The Secret Science of Price and Volume" by Timothy Ord, buy at www.Amazon.com.
