SPX Monitoring purposes; Neutral.
Monitoring purposes GOLD: Sold 11/27/18 at 18.88=gain .075%; Long GDX at 18.72 on 8/17/18
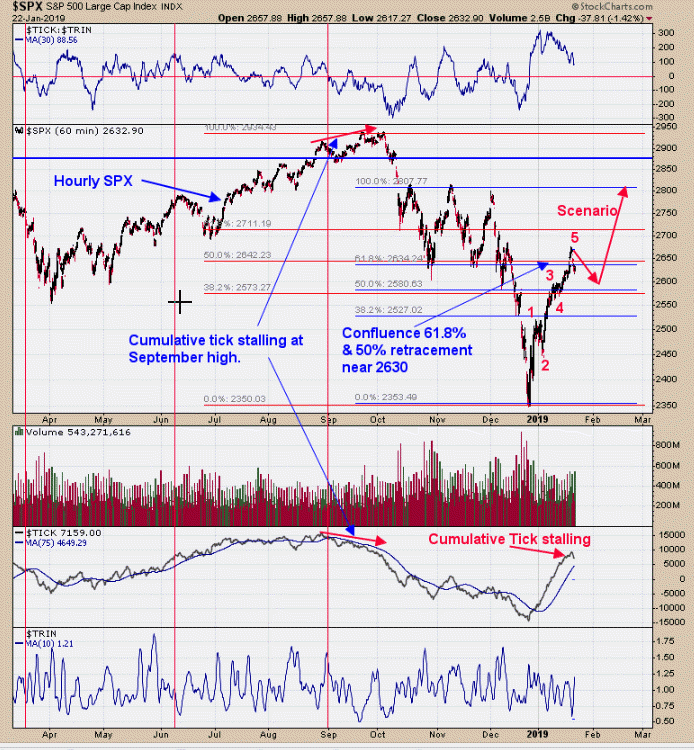
Long Term Trend SPX monitor purposes; Long SPX on 10-19-18 at 2767.78 There is a confluence of Fibonacci levels of 50% and 61.8% retracement level at 2640 SPX range, which is where the November and December lows lie along with the 50-day moving average (not shown); all are resistance zones. An Elliott Wave five count up appears to have completed on Friday and an “ABC” correction could be in the making. The TICK closed at -122 and TRIN at 1.62 and, off tops, this reading can be a bearish short term sign, which can lead to another day or two of decline but not usually a big decline. The second window up from the bottom is the Cumulative TICK, with a 75-period moving average. The Cumulative TICK has moved down modestly, showing that momentum is weakening in the short term. If TICKs don’t explode negatively in the coming days, it could lead to a bullish setup.
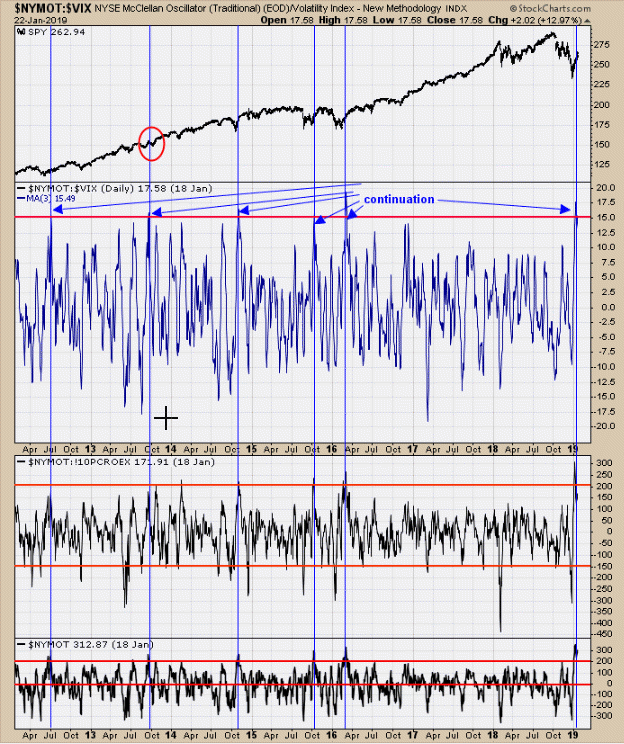
 The middle on the chart above is the NYSE McClellan Oscillator/VIX ratio. When this ratio has reached above +15 (going back 7 years), the market continued its rally in the following weeks. In 2013 (circled in red) there was a brief consolidation that lasted a couple of weeks; in the other cases, the market marched higher each time (other than a couple days' consolidation). As reported on last Thursday’s update quoted by Bullmarket.com, “For the 10th day in a row, the S&P 500 $SPX has closed higher than the daily OPEN. This has happened 10 other times from 1962-present, 9 of those 10 times saw the S&P higher 1 week later average gain of .29%.” Though the market was higher 90% of the time, the rally was only .29%. Trend is up.
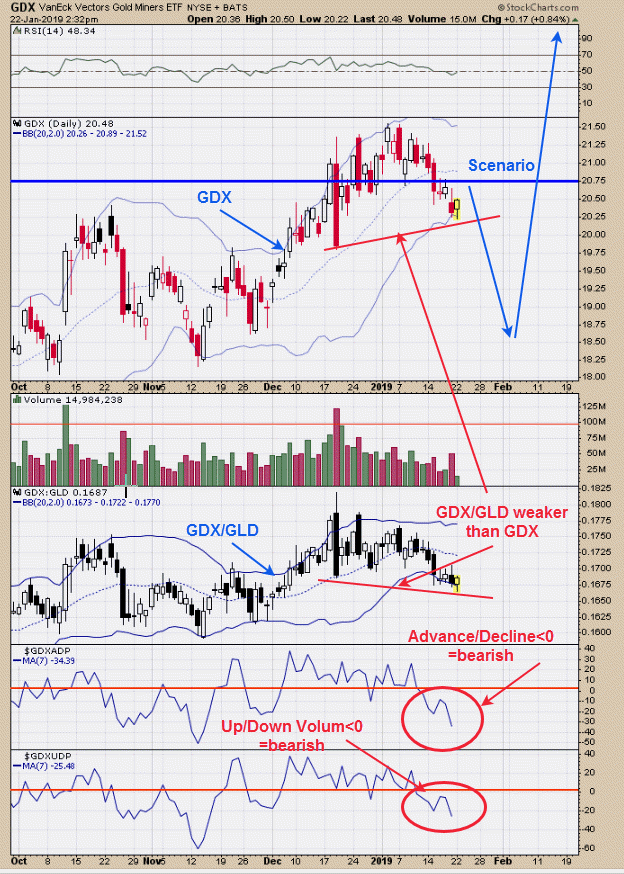
 Above is a short term view for GDX. The bottom window is the Up/Down Volume Percent with a 7-period moving average, which, when above “0,” is a bullish condition for GDX and, when below, a bearish condition. This indicator has been below “0” since January 10. The next window up is the Advance-Decline Percent with a 7-period moving average, where readings below “0” are bearish (current reading is -34.39). The next window up is the GDX/GLD ratio. It’s a bullish sign for gold and gold stocks when this ratio is outperforming GDX. The GDX/GLD ratio closed below its December 19 low and GDX held above, showing that the GDX/GLD ratio is weaker than GDX - a bearish sign for both gold and Gold stocks short term. There are cycles for a low due from late January to early March; we are entering this cycle low now. This potential pullback could lead to a longer bullish setup. We will wait for the next bullish setup.
Tim Ord,
Editor
www.ord-oracle.com. New Book release "The Secret Science of Price and Volume" by Timothy Ord, buy at www.Amazon.com.
