
SPX Monitoring purposes; Sold SPX on 2/12/19 at 2744.73 gain 1.36%; long 2707.89 on 2-8-19.
Monitoring purposes GOLD: Long GDX on 1/29/19 at 21.96.
Long Term Trend SPX monitor purposes; Long SPX on 10-19-18 at 2767.78
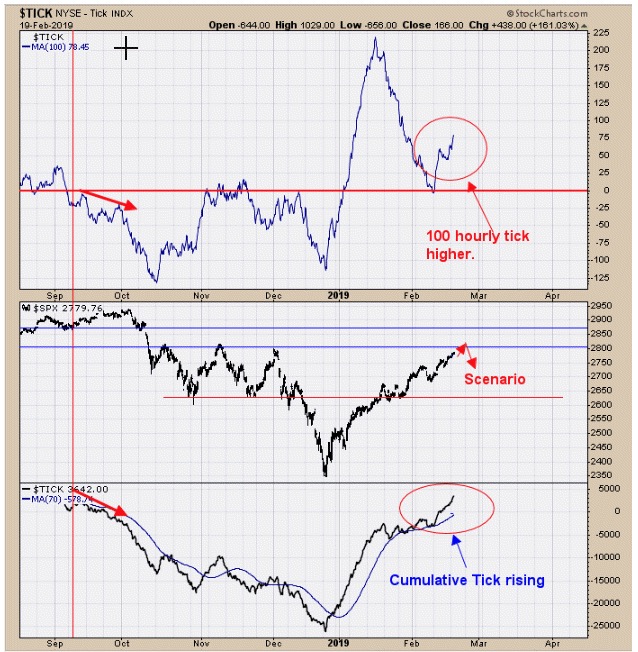
The top window is the hourly 100 period moving average of the tick. In general the tick rises and falls with the market. Tick readings below “0” are bearish and above “0” bullish. So market the 100 hour ticks have remained above “0” which implies the short term momentum is up. SPX may wiggle higher into the still resistance area near 2800 level (November and December highs) and we will see what the ticks do there. Bottom window is the cumulative tick which is still rising and a positive short term. We will wait for the next setup. Join us on twitter. @OrdOracle Ask for free 30 day trial.
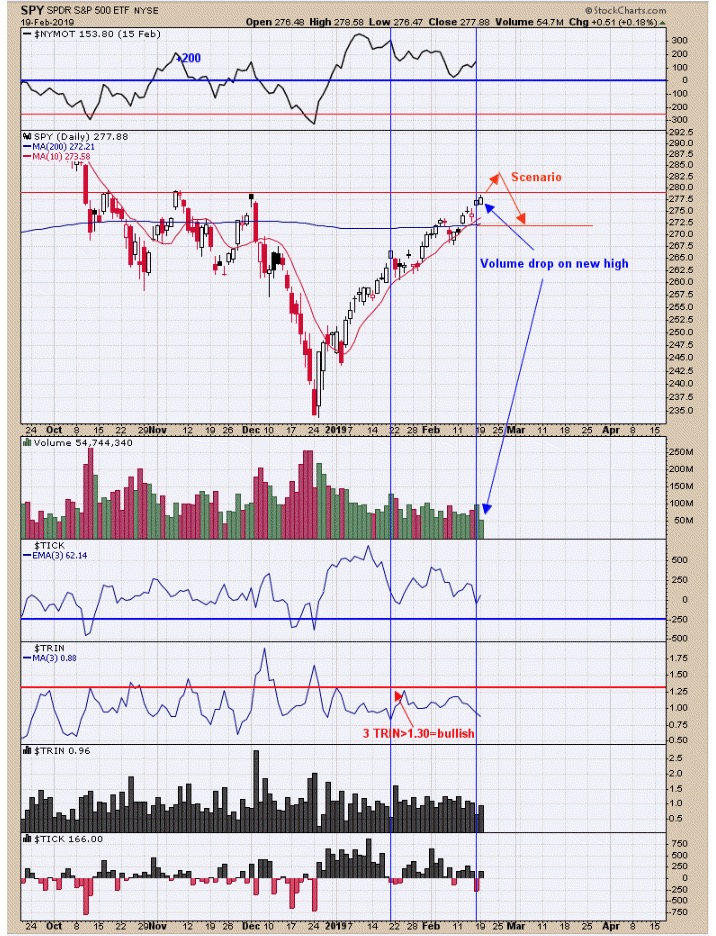
Market may grin higher to next major resistance at 2800 SPX. Last Friday the SPY was 1% higher and Ticks closed at -272. There are more times market was higher going back several months but the last time the market was higher near 1% with down ticks came on January 18. In most cases market higher on down ticks is usually a bearish sign. Today SPY closed at a new short term high and volume drop near 50%. Volume should expand has market moves higher and if not than a bearish sign. Most likely market could push above the November and December highs near 2800 where a bearish signal could be triggered. Support comes in near the 200 day moving average near 2725 SPX level. Bearish signs are accumulating but momentum is still up. Neutral for now. Follow us on twitter. @OrdOracle
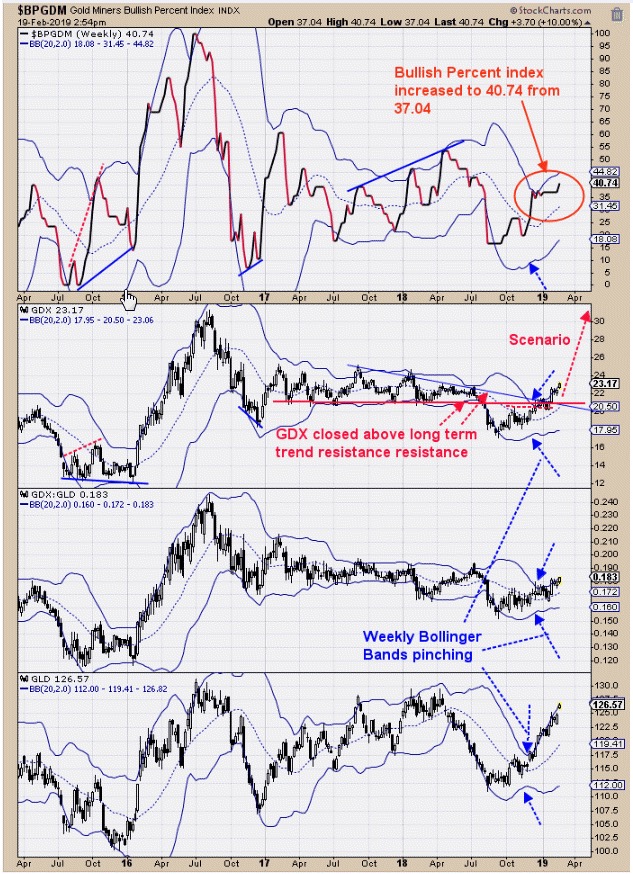
The top window is the weekly Bullish Percent index for the Gold miner’s index. The bullish percent index measures the percent of stocks that are on point and figure buy signals. The recent jump from 37.04% to 40.74% is a jump in the right direction and should see more stocks participate in the coming weeks. Back in December we pointed out the Bollinger bands where “pinching” on GDX, GDX/GLD and GLD and suggested a large move was in the making and it turns out the large move has started to the upside. A “flag” pattern formed on the daily GDX (not Shown) that ended last week and an impulse wave up has started. Its common for “Flag” patterns to form at the half wave point of the move which would give a target on GDX near 24.50 range as the next resistance area. GDX, GLD and GDX/GLD have all been trading in a consolidation for two years and after a consolidation an impulse wave starts and it appears that impulse wave up has started that could last two years or longer, enjoy the ride. Long GDX on 1/29/19 at 21.97. www.ord-oracle.com. New Book release "The Secret Science of Price and Volume" by Timothy Ord, buy www.Amazon.com.