
SPX Monitoring purposes: Flat.
Monitoring purposes GOLD: Long GDX on 1/29/19 at 21.96.
Long Term Trend SPX monitor purposes: Sold long-term SPX on 10/24/19 at 3010.29=gain 1.49%; Long SPX on 10/14/19 at 2966.15.
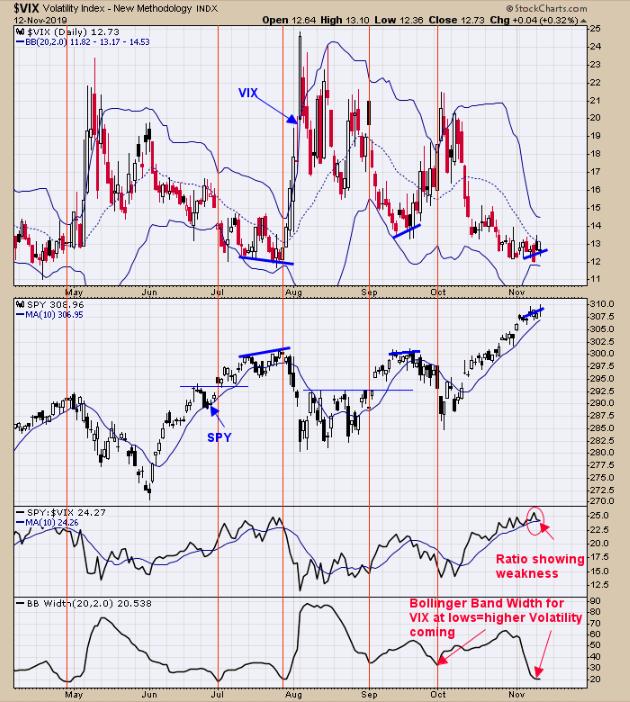
On the above chart, the second window up from the bottom is the SPY/VIX ratio. It's bullish for the market when this ratio is rising, showing that SPY is outperforming the VIX. In general, this ratio has been moving sideways the last week or so. A bearish sign is triggered when this ratio falls below its 10-period moving average (so far, it's above this moving average). The bottom window is the Bollinger Bandwidth for the VIX. When the VIX enters into a narrow range, the Bollinger Bandwidth drops to a low level, warning that a volatility increase is not far off. The red vertical lines show when the Bollinger Bandwidth drops to low levels. Some sort of a high may not be far off.
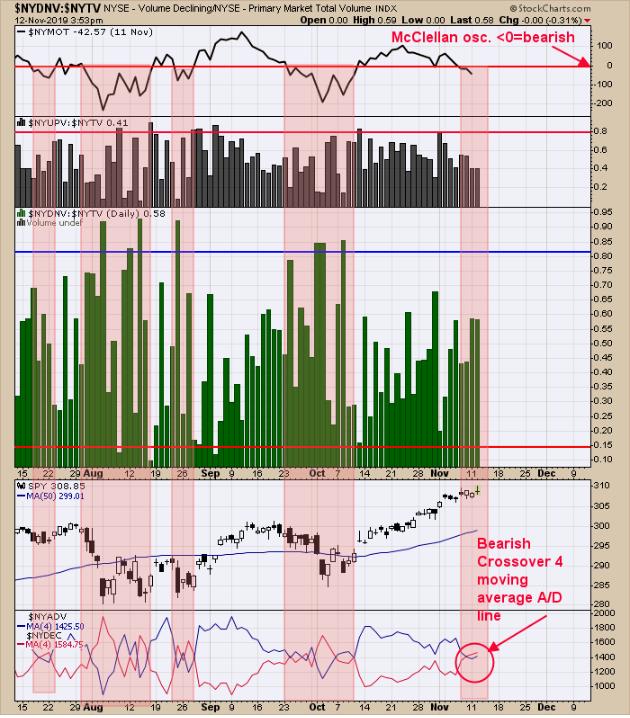
The top window above is the NYSE McClellan oscillator. Readings above "0" are bullish and those below are bearish. Yesterday's close came in at -42.57 and today's reading will be lower as the Advance/Decline was negative. The tan areas show the times when the McClellan Oscillator was below "0". The bottom window is the NYSE Advancing with a 4-day average and NYSE Declining with a 4-day average. A bearish crossover of this Advancing/Declining moving average about three days ago and another bearish sign. This is options expiration week, and the November option expiration week is up 63.64% of the time (going back to 1984). Sometimes the TRIN can play an important role in signaling a top. When market is in a rally phase and the TRIN closes >1.50 on a high day, that can signal that a top is near; today's TRIN closed at 1.27 (not high enough). It is starting to look like a pullback that could test the 3000 support level is developing. Time cycles point to a low near Thanksgiving. Being patient for now.
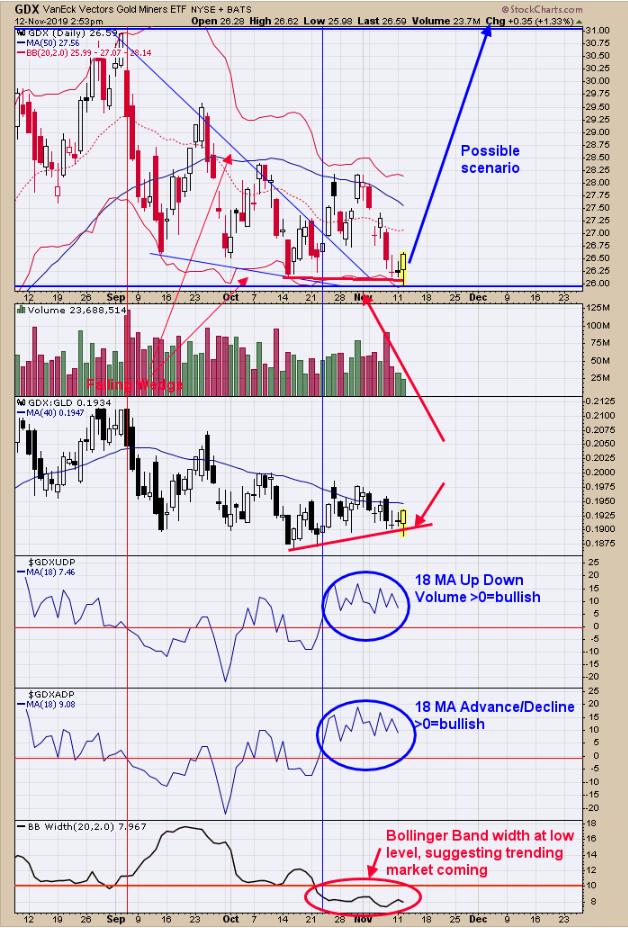
We updated this chart from yesterday. Yesterday, we said that "[t]he two important indicators on this chart are the 18 average of the GDX Up Down Volume Percent and 18 average GDX Advance/Decline percent (second and third window up from bottom). Since October 23 (GDX close 26.81) the 18 moving averages of GDX Up Down Volume and Advance/Decline have been staying above '0' which have been bullish for GDX in the past. GDX has tested the mid October lows but both indicators remain bullish with readings above '0'. The bottom window is the Bollinger Bandwidth which has stayed below '10' for an extended time, suggesting market is not far from an impulse wave. Middle window is the GDX/GLD ratio. This ratio is making higher lows while GDX has made lower lows, showing that GDX/GLD ratio is stronger than GDX and a bullish sign." With these bullish indicators, it appears that GDX impulse wave could start at any time. Long GDX on 1/29/19 at 21.97.
Tim Ord,
Editor
www.ord-oracle.com. New Book release "The Secret Science of Price and Volume" by Timothy Ord, buy at www.Amazon.com.