
SPX Monitoring purposes: Long SPX on 12/13/19 at 3168.80.
Monitoring purposes GOLD: Long GDX on 1/29/19 at 21.96.
Long-Term Trend SPX monitor purposes: Sold long term SPX on 10/24/19 at 3010.29=gain 1.49%; Long SPX on 10/14/19 at 2966.15.
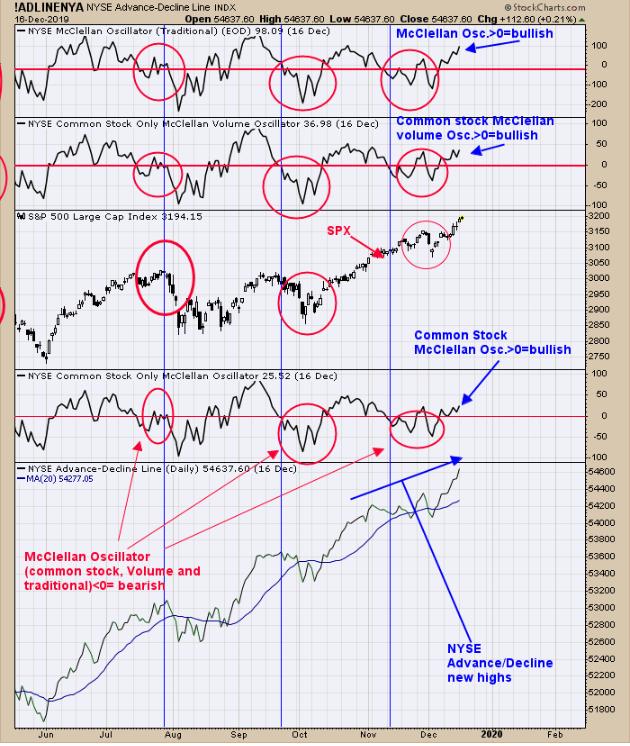
We updated this chart from yesterday. (Bottom window) Advance/Decline closed higher than yesterday at another new short term high. The NYSE Common Stock-only McClellan Oscillator, NYSE Common Stock-only McClellan Volume Oscillator and NYSE McClellan Oscillator all closed higher then yesterday and all above "0", which suggests the trend is up. The CNN Fear & Greed index is at 81 (Extreme Greed), so the rally may not last long. We should get signs that rally is coming to an end when the McClellan Oscillators (the three above) approach the "0" level. Next Tuesday is December 24 and the anniversary of last year's low. Important highs and lows of the past can mean important reversals in the future. Next Tuesday is important if the market continues to rally into that timeframe. Long SPX on 12/13/19 at 3168.80.
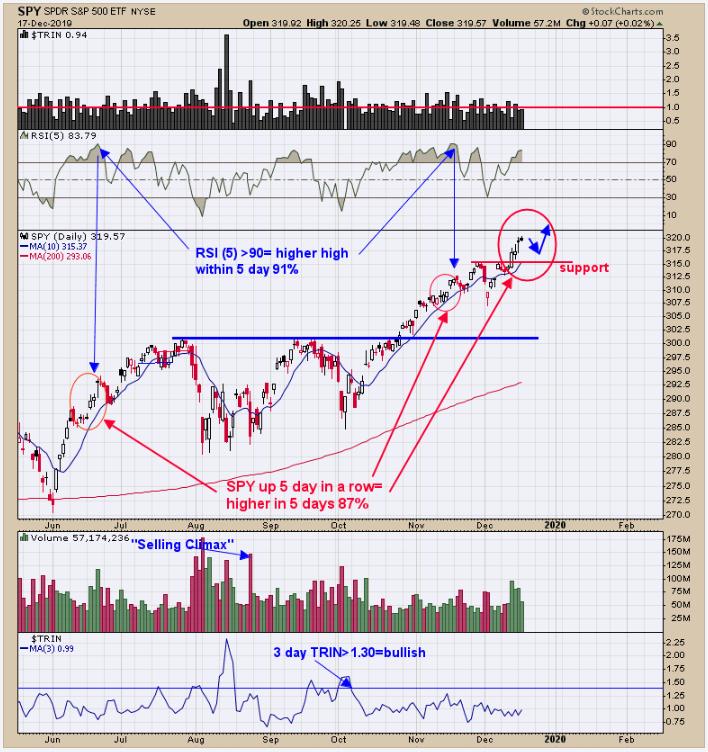
This week is December option expiration week, which has been higher 78% of the time. Today's rally marks the fifth higher day in a row. Five days up in a row suggests the market will be higher within five days by an average gain of 1%, 87% of the time. Five trading days from now is next Tuesday, which would give a target near 323.20 on the SPY and 3230 on the SPX. The anniversary of last year's low was December 24. Yearly anniversaries of important highs and lows can mark important reversals. Next Tuesday is December 24.
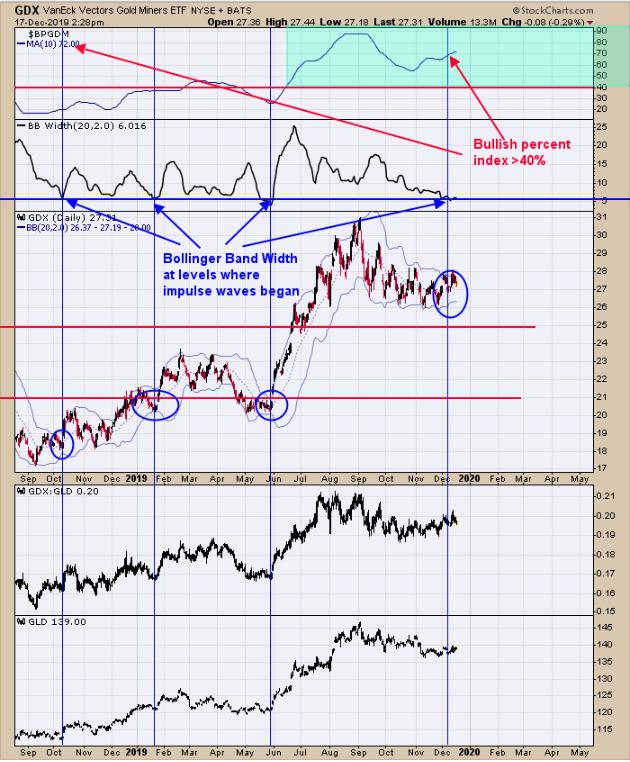
The top window is the 10-period moving average of the Bullish Percent index for the Gold Miners index. Readings above 40% (current reading is 72%) suggest the market is in an uptrend. The second window down from the top is the Bollinger Bandwidth for GDX. When the Bollinger band start to pinch, then the Bollinger Bandwidth moves to a low level. A low level in the Bollinger Bandwidth suggests a large move in the market is not far off (in this case, it would be for GDX) and at a level where GDX had large moves in the past. Since the 10-day average for the Bullish Percent Index for the Gold Miner's index is bullish, it appears the move will be up. We don't have it shown, but Precious Metals index has a bullish Seasonality in January and part of February of election years. Our thought is that most of the gains will come early next year. Long GDX on 1/29/19 at 21.97.
Tim Ord,
Editor
www.ord-oracle.com. New Book release "The Secret Science of Price and Volume" by Timothy Ord, buy at www.Amazon.com.