
SPX Monitoring purposes: Long SPX on 1/28/20 at 3276.24.
Monitoring purposes GOLD: Long GDX on 1/29/19 at 21.96.
Long Term Trend SPX monitor purposes: Sold long-term SPX on 10/24/19 at 3010.29=gain 1.49%; Long SPX on 10/14/19 at 2966.15.
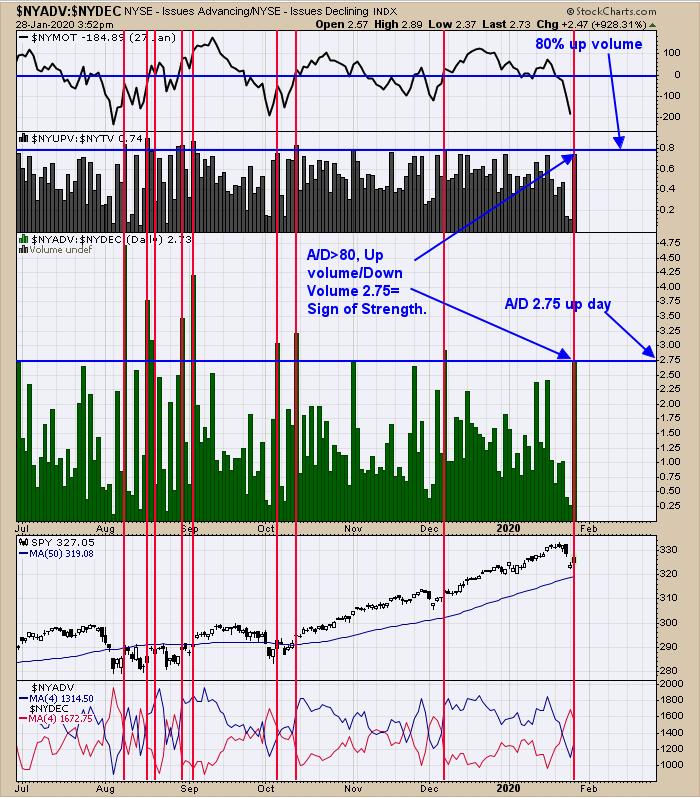
Yesterday, we had signs of exhaustion; today we have signs for a "Sign of Strength." Today's bounce in the SPY (SPX) produced an Advance/Decline ratio of 2.75 and also an Up/Down Volume ratio near 80%, both of which suggest a "Sign of Strength" (SOS) right off a bottom. The red vertical lines on the chart above show previous instances when an SOS was present. Yesterday's two-day TRIN added up to 4.46. We have noted that, in the past, when a two day TRIN adds up to 5.00, the market is at a bottom. The 4.46 TRIN reading suggests the market is sold out. A test of the recent low is possible. Long SPX on 1/28/20 at 3276.24.
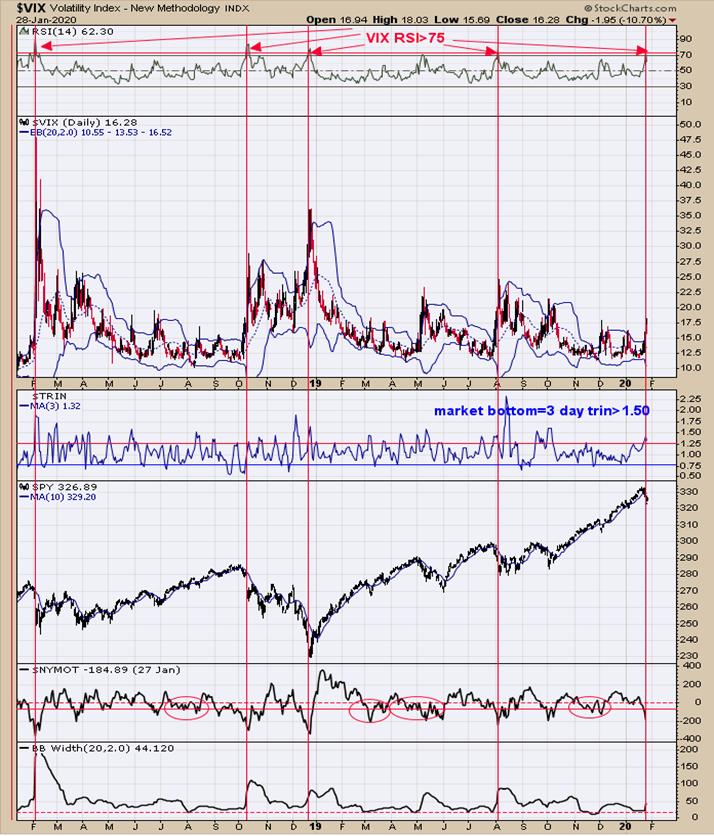
Panic happens at bottoms and we look for indicators that have reached panic levels. The top window in the chart above is the RSI for the VIX. When the RSI reaches above 75 (yesterday's close was 75.10), the market is near a bottom. This chart goes back two years and shows the times (red lines) when the RSI of the VIX reached 75, which is fairly rare. There could be backing and filling short-term, but, in general, the market should work its way higher in the coming days.
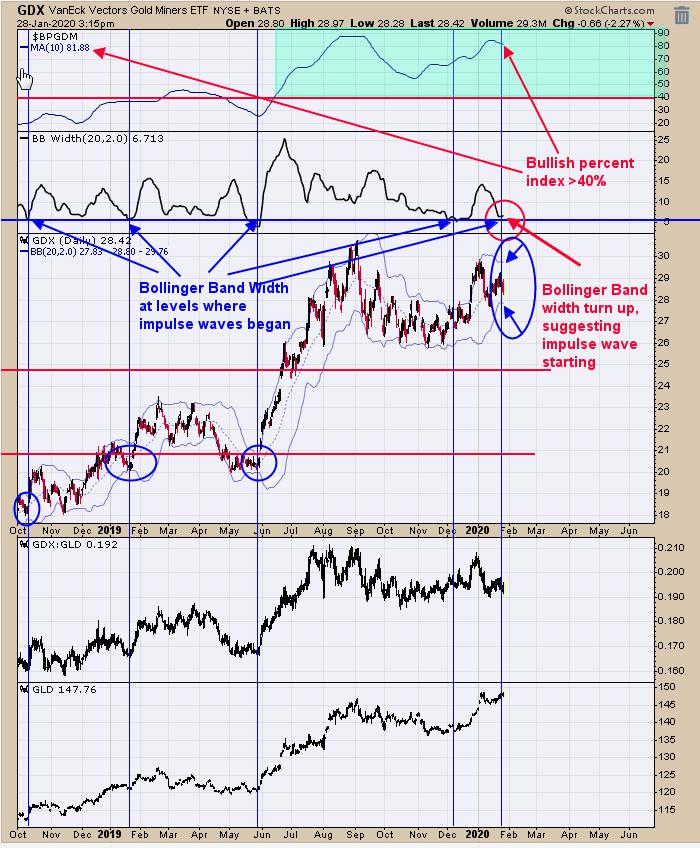
The top window is the 10-period Bullish Percent Index for the Gold Miners Index, which stands at 81.08 (81.08% of the Gold Miners Index stocks are on Point & Figure buy signals). It's considered an index in a bullish move, with a reading above 40%. The next window down is the Bollinger Bandwidth for GDX. When Bollinger Bandwidth is at a low level, that suggests the Bollinger Bandwidth for GDX is pinching. A pinching of the Bollinger Bands suggests a consolidation is nearing an end and an impulse wave is about to begin. Since the Bullish Percent Index is above 40%, that suggests the impulse wave move will be up. We have marked previous times with blue vertical lines when the Bollinger Band width was near current levels. The move may start around the FOMC meeting announcement, which is tomorrow. January is seasonally bullish for gold and gold stocks during election years, of which this year is one. Long GDX on 1/29/19 at 21.97.
Tim Ord,
Editor
www.ord-oracle.com. New Book release "The Secret Science of Price and Volume" by Timothy Ord, buy at www.Amazon.com.