Hello fellow StockCharts users! My name is Aleksandar Bozic I'm the newest contributor for the Top Advisors Corner blog. I have a passion for technical analysis and, more specifically, "breakouts." I strongly believe that breakouts are the strongest technical signal due to the momentum that follows them. I'm so passionate about breakouts that I have even created my own scans that find breakouts & breakdowns. I will try and offer a few potential breakouts and breakdowns from my personal scans in these articles.
Today, I would like to look at BBY (Best Buy), NVDA (NVDIA Corp) and SQ (Square Inc.). These three stocks have all appeared on my US Long Scan in the month of February. Let's now take a look at each stock individually!
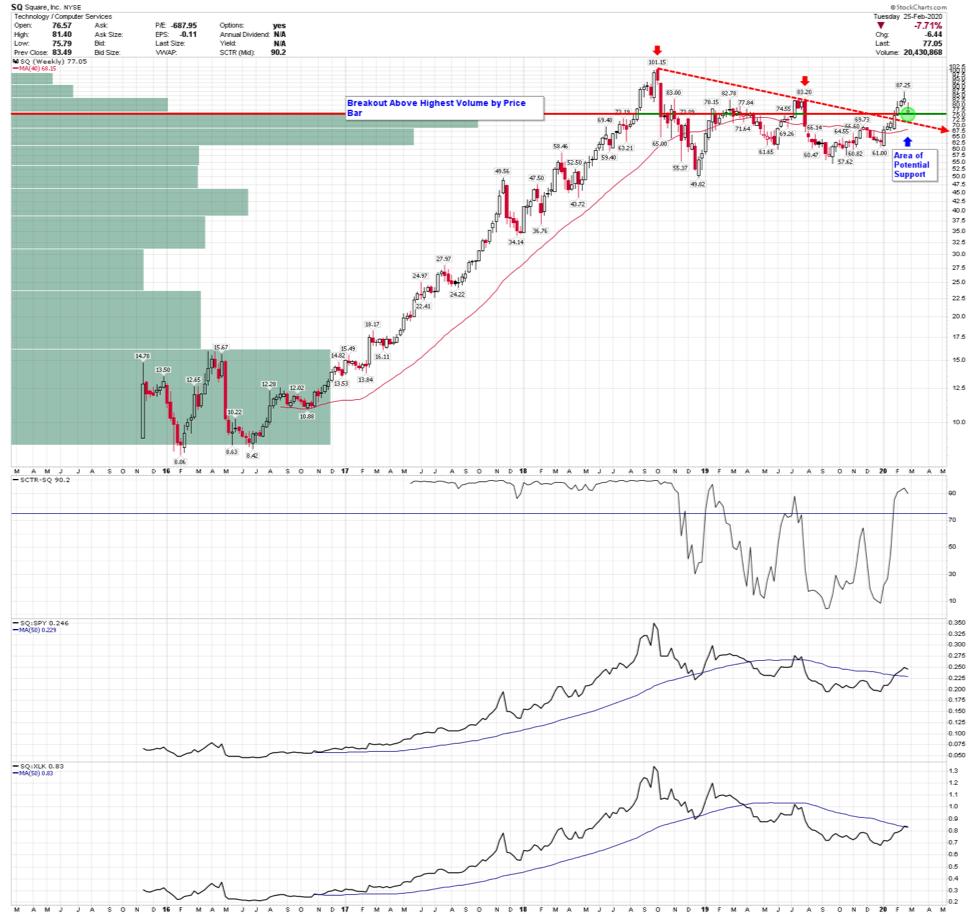
Square has recently broken out from a downtrend that started back in late 2018. The stock ran up to $87 before pulling back recently to $77. This offers a potentially attractive entry price, as we are back to the highest volume by price bar. This tells me there is significant support at this level. We are also above the 75 level on the SCTR, which tells me we are still in the top quartile of Mid-Cap Stocks. We have also broken out from a downtrend in relative performance and, as you can see, the 50-day moving average overlay is starting to slope back up.
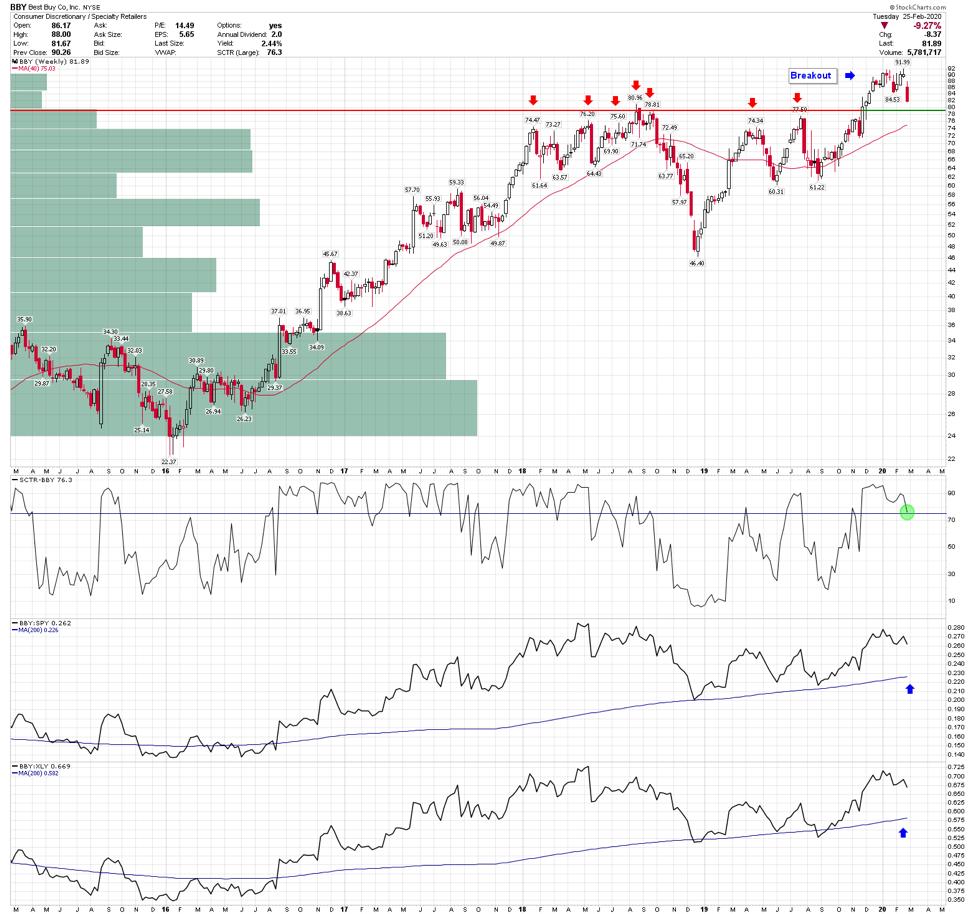
Best Buy is another stock that has broken out a multiyear base and is nearing the $78 level where it broke out from. The SCTR surged past 75 when it broke out and is now coming back to 78, which is positive. The relative performance indicators are all above the 200-day moving average overlay and are confirming relative outperformance.
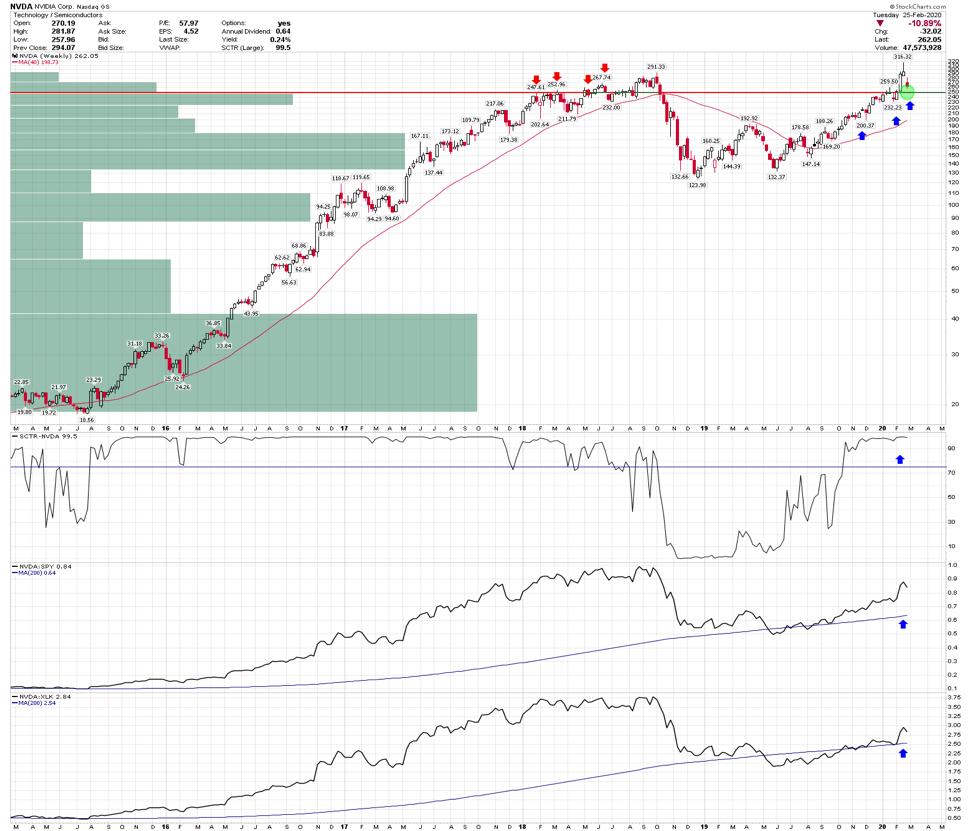
NVDIA is a very interesting setup as well, as it had quite a decline into 2019 and is now finally breaking out to new highs. With the recent pullback, we seem to be approaching the breakout level where we should find possible support. In addition, NVDIA has moved from the top quartile in the SCTR, confirming its strength. The relative performance indicators are all above their 200-day moving average and are showing relative outperformance.
- Aleksandar Bozic