
SPX Monitoring purposes: Long SPX on 2/24/20 at 3225.90
Monitoring purposes GOLD: Long GDX on 1/29/19 at 21.96.
Long Term Trend SPX monitor purposes: Long SPX on 1/30/20 3283.66; sold 2/21/20=gain 1.65%.
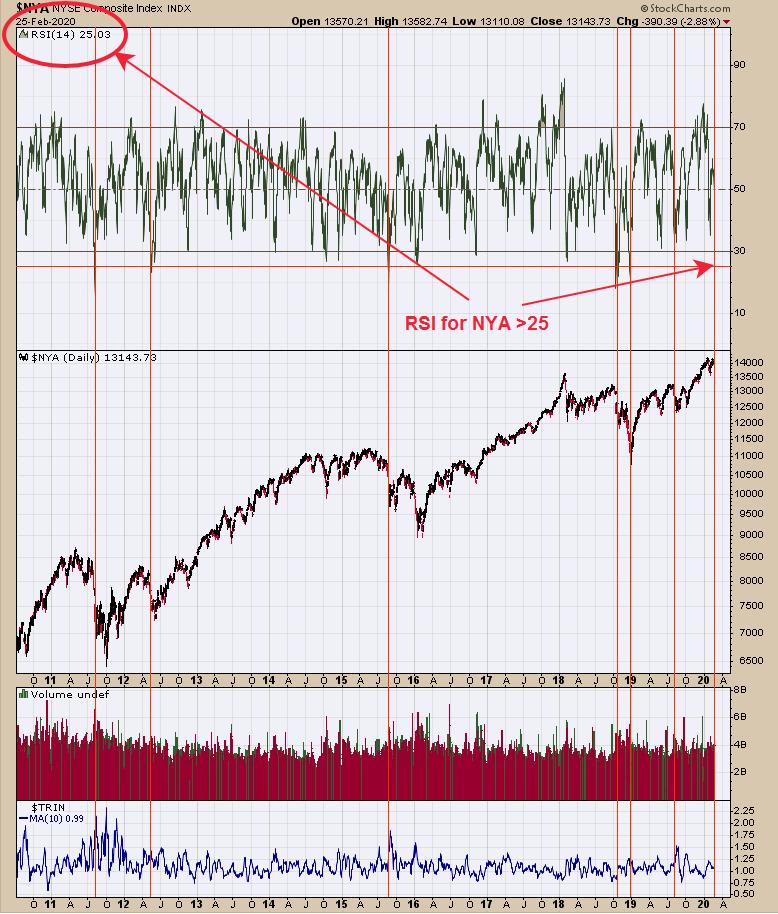
This chart is the daily NYA (NYSE composite) with RSI going back to late 2010. We labeled with red vertical lines when the RSI for the NYA fell below 25 (today's close came in at 25.03). We did go back further than 2010, but the chart was hard to read and didn't change the theory of any degree. Our point in this chart is that RSI momentum has reached a level where a bounce can be expected in the NYA. Some 25 RSI levels came at major lows; others came where trading ranges started. It is obvious it would have been better to be long today rather than yesterday, but condition suggests at a minimum that a bounce is near.
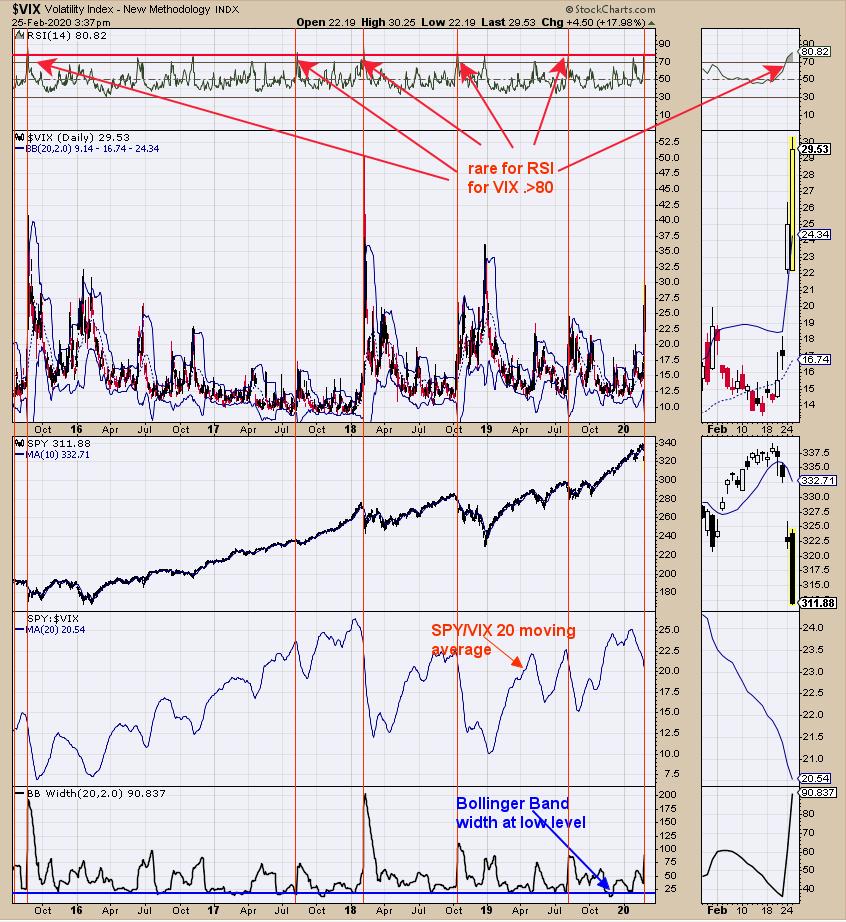
Some statistics: the last 20 times (going back to 2010) the market gapped down >3% (yesterday's gap >3%), the market has gone higher 18 times (90%) by an average of 2.81% in five days; The two losses average 2.10%. SPX is down four days in a row; it closed higher 81% of the time within five days, average gain 1.2%. The TRIN closed yesterday at 1.53 and the TICKs closed at -261; both are in panic levels. When TRIN and TICKs reach panic levels, the market bottoms between the same day as the readings to as late as two days later (two days later would be tomorrow). The top window in the chart above is the RSI for the VIX. RSI readings for the VIX above 75 is another form of panic and readings above 80 are rarer; today reached 80.82. This acceleration in the VIX usually leads to a snap back in the SPX. SPX (SPY) could attempt to fill the down gap in the coming days. Different forms of panic are present on the current decline, suggesting a bottom is near.
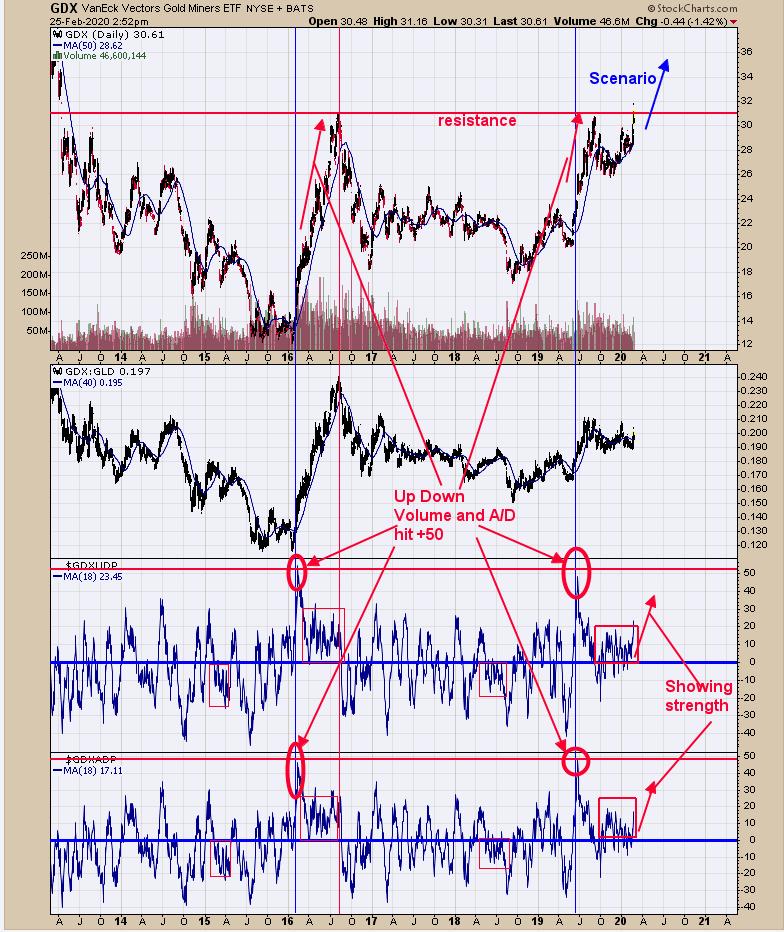
The top window is the GDX, which is up against the resistance level near 31.00 range. We do expect the 31.00 range to be overcome in the coming days for weeks. The bottom window is the Advance/Decline percent with an 18-period moving average. In general, readings above "0" have lead to rallies, and this indicator has been "coiling" above 0 since last October and has now started to rally, a bullish sign for GDX. The next window up is the Up Down Volume Percent with an 18-period moving average. This indicator also has been "coiling" since last October above the 0 and has started to rally as well, which is also bullish for GDX. In our view, there is at least another 10-point rally in GDX coming (that statement may change). Long GDX on 1/29/19 at 21.97.
Tim Ord,
Editor
www.ord-oracle.com. New Book release "The Secret Science of Price and Volume" by Timothy Ord, buy at www.Amazon.com.