Although the Transportation IYT was not the first one to show signs of weakness long before the recent crash, this sector has broken down hard. (The distinction of the first sector to tell us something was amiss goes to our Prodigal Son Regional Banks KRE. I gave that head's up in a Daily back on January 15th.)
Through the years, Transportation has been our "go to" for reliable information on whether the market is ready to turn back up. Therefore, I thought it relevant to look at the 200-week moving average (green line) and see if today's hard landing could mean something good for the market.
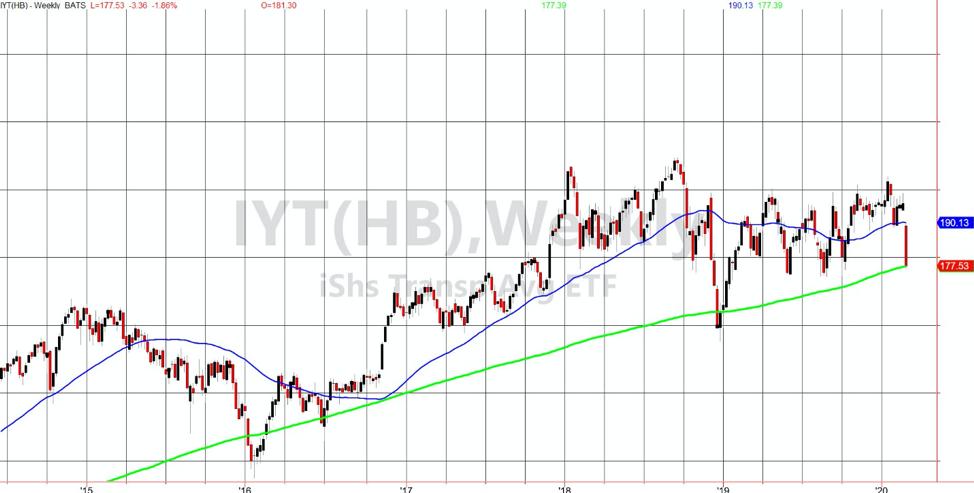
On the weekly chart of the ETF Transportation IYT, you can see the green 200-WMA. Going back to early 2016 - Brexit - while the 200-WMA sloped up, the price broke it for a few weeks. Then, once the price returned above it, it was smooth sailing - until we saw a one-week breach of it in July 2016. Then, the following week, it opened just below the 200-WMA and proceeded to rally, not looking back until late 2018. After two weeks under the 200-WMA, IYT was one of the first of the Economic Modern Family sectors to return above the MA. That led to the great rally of early 2019.
Today, IYT touched down on the 200-WMA (still with a positive slope) for the fourth time in 4 years. That leads me to wonder whether it will hold again, giving us a low risk buy opportunity in not only this sector, but in other sectors of the market as well. Or, if the 200-WMA cannot hold like in 2016, how many weeks must we sit while this trades below that area?
What I do know is that, if the 20-WMA cannot hold, we could see those late 2018 levels. Plus, if we cannot sell off that far, once price recaptures the 200-WMA we have a good reason to jump back in long.
- S&P 500 (SPY): Officially oversold. A bounce is possible, but that is different than a bottom. 320 resistance with 307.75 support
- Russell 2000 (IWM): Confirmed Distribution phase, 156.67 resistance w
- Dow (DIA): Confirmed distribution phase; 272.48 pivotal
- Nasdaq (QQQ): Confirmed caution phase; 221 pivotal resistance; 216 weekly support
- KRE (Regional Banks): 48 support with resistance at 54.00
- SMH (Semiconductors): Inside day; range to break 140.94-134.21
- IYT (Transportation): 177.40 the 200-WMA.
- IBB (Biotechnology): THIS WORKED PERFECTLY - 117.35 key pivotal area - if clears then could buy with stop under 116.48 looking for 120 area
- XRT (Retail): Poor Granny - Unless it gets back over 43.00, that weekly double top could really smash this
- Volatility Index (VXX): Inside day
- Junk Bonds (JNK): Over 108.50 and hold, perhaps the worst is over for the time being
Mish Schneider
MarketGauge.com
Director of Trading Research and Education
