On February 19th, the benchmark S&P 500 (SPX) had just set a new all-time high before collapsing by 538 points, or 16%, by February 28th into formidable underlying support at 2856 to 2822. This support level is highlighted in green in Chart 1 below.
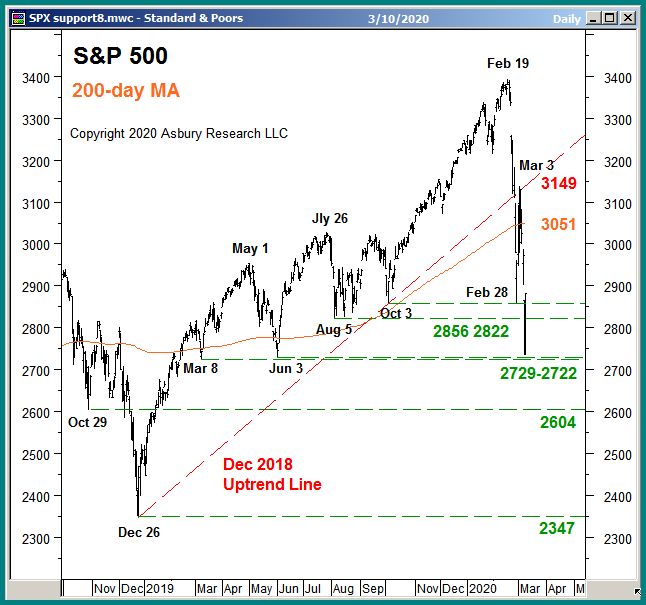
Chart 1
In between those two dates, my firm Asbury Research's tactical models -- the Correction Protection Model (CPM) and Asbury 6 (Table 1 below) shifted to a Risk Off/Negative status and has remained there since.
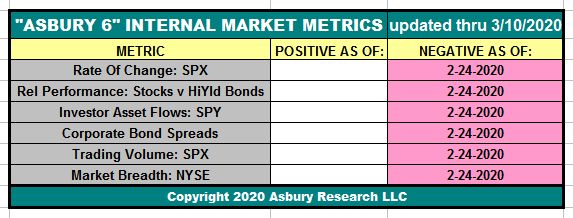
Table 1
The Asbury 6 is comprised of six diverse market metrics that we use as a lie detector test for the market — to help identify real, sustainable market advances or declines from computer-driven traps for investors. Five of them are not related to price, on purpose, because algorithmic trading now accounts for about 80% of the daily volume in the US stock market. Many of these computer-generated trading programs cause quick, sharp moves in financial asset prices that provoke people to make emotionally driven, ill-timed trading decisions that enter or exit the market at the worst possible times and places. Looking beyond price via the non-price-driven metrics in the Asbury 6 helps us to determine noise from meaningful changes in market direction.
Chart 1 above also shows that support at SPX 2856 to 2822 initially held, which helped to trigger a quick rally back to the 3149 area by March 3rd. This 3149 area represents the underside of the December 2018 uptrend line, which was initially broken on Feb. 27th, turning the major trend down. This rally back to 3149 quickly failed, however, and the index subsequently declined to the next underlying support level at 2729 to 2722, which represents the June and March 2019 benchmark lows. This level continues to be tested as this is being written.
This step-by-step process as described above is a textbook example of the stock markets' discounting mechanism at work - moving from level to level as investors collectively attempt to handicap the ultimate effects the coronavirus will have on the US and global economies.
This new major downtrend in the S&P 500 will remain intact below the 3051 to 3149 area, which represents the 200-day moving average and the underside of the December 2018 uptrend line. Below the market, should 2729-2722 support be broken, the next key level is an additional 5% below the market at 2604.
We consider our primary job at Asbury Research and Asbury Investment Management to be helping our clients protect their assets -- especially during extreme market conditions like we are seeing now. But, right after that, our next responsibility is the reallocation of those assets at lower and better levels. This task requires taking market risk again and is where correctly identifying the key index levels below and above the market becomes critical.
The second part of this process is differentiating a support level that is just a speed bump in a collapsing market from one that can actually develop into an investable bottom -- i.e. a place to reallocate those assets. We use our A6 and CPM models for this, but the average investor can use readily available tools like trading volume, which measures urgency, investor asset flows, which measure conviction, and market breadth, which measures investor participation, to help to measure the quality -- and potential sustainability -- of any market rally. These metrics and more are all available via StockCharts and other charting packages.
Our latest video below shows how we have navigated these recent market conditions in real time.
John
John Kosar
Chief Market Strategist, Asbury Research
Click Here for our March 10th, 2020 video review, which explains how we have recently utilized Asbury Research's market analysis and investment ideas to professionally manage client portfolios.
Asbury Investment Management (AIM) offers a unique approach to investment management that is data driven, dynamic, and solely based on the current technical condition and quantitative risk/reward profile of the financial markets.
If you would like to learn more about Asbury Research, click here to contact us and type "subscription info" in the Reason For Inquiry text box, or call 888-960-0005.
If you would like to learn more about Asbury Investment Management (AIM), please email contact@asburyinvest.com or call 1-844-4-ASBURY (1-844-427-2879).
This communication is for informational purposes only. It is not intended as investment advice, or as an offer or solicitation for the purchase or sale of any financial asset. No inferences may be made and no guarantees of profitability are being stated by Asbury Research LLC. The risk of loss trading in financial assets can be substantial. Therefore, you should therefore carefully consider whether such trading is suitable for you in light of your financial condition.