
SPX Monitoring purposes: Flat
Monitoring purposes GOLD: Long GDX on 1/29/19 at 21.96.
Long Term Trend SPX monitor purposes: Flat
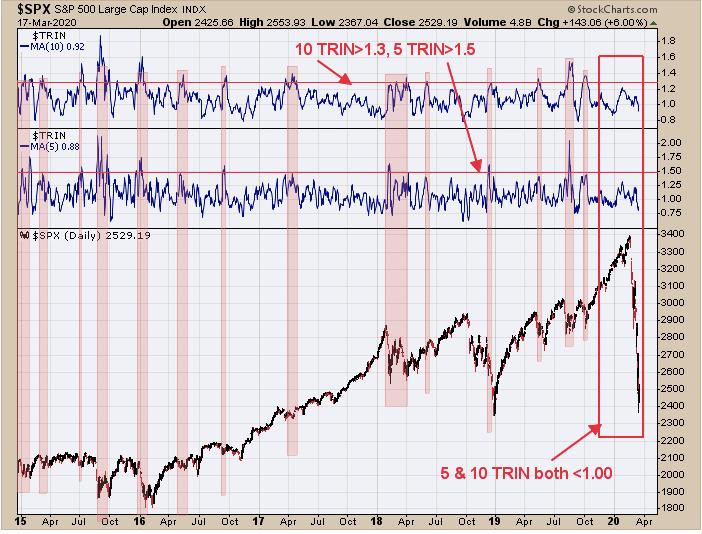
The above chart goes back over five years and shows the times when the 10-day TRIN reached above 1.30 (panic level) and the 5-day above 1.50 (panic level), noted in light pink. When panic has been reached in the TRIN, the market is usually near an important low. So far, on the current drop, the 5-and 10-day TRIN failed to get even above 1.00. Things could be different this time around, but it is very unusual to have a market that has crashed and not had panic readings recorded in the TRIN. Either this time is different or panic readings in the TRIN will come later, when the market is lower.
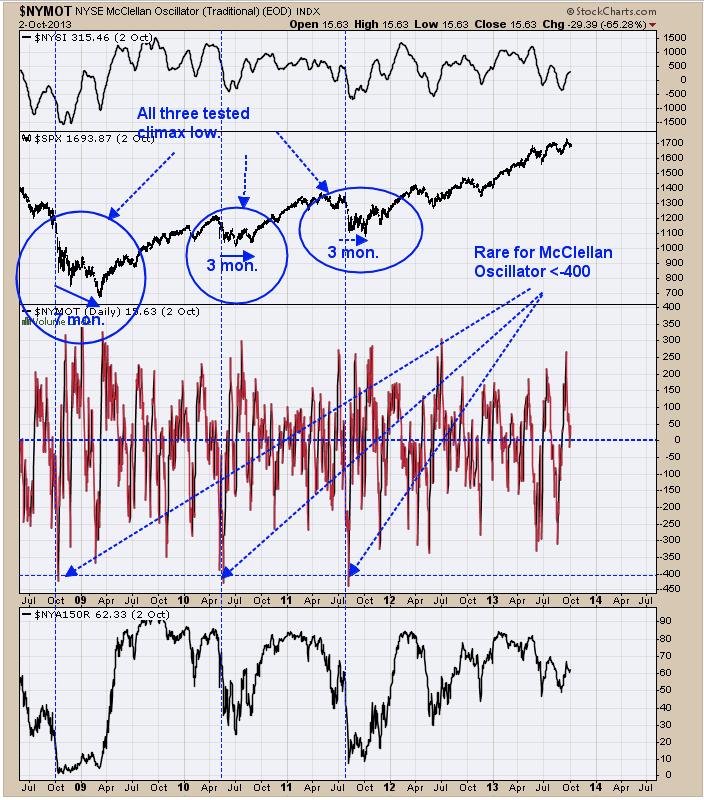
On February 28 and March 12, the McClellan Oscillator hit below -400. We have to go back to 2008, 2010 and 2011 to find the last time that happened. In 2008, after hitting -400 on the McClellan Oscillator, the SPX worked lower over the next seven months making three lower lows. In 2010, the SPX flipped sideways for three months after the McClellan Oscillator hit below -400, producing a pattern that looked like a head-and-shoulders bottom. In 2011 the market flipped sides again for 3 months and, at the end of those 3 months, hit a new low before reversing higher. The point of this exercise is that market may build a base for several months before the reverse higher is accomplished. Also, the TRIN has not produced panic readings, which are what is needed for a rally to start.
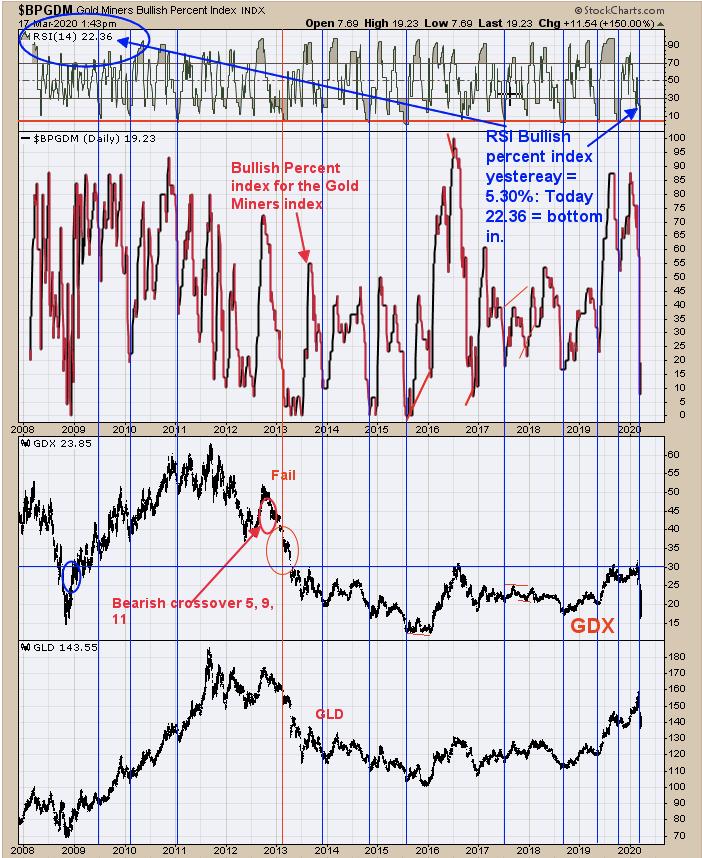
On Thursday's report, we wrote "Above is an indicator that gives few signal but the signals it gives are usually actuate. The chart above dates back to 2008 and shows the times when the RSI for the Bullish percent index for the Gold Miners index falls below 10% and then turns up. As of yesterday's close the RSI stands at 6.07 and today close may be lower. The RSI needs to turn up to complete the signal and therefore the signal is in the range but has turned up. Of the 12 signals since 2008 (about one a year) there was only one failure (92% correct) which was in 2013. Any short term rally most likely will turn up the RSI." The RSI for the Bullish Percent Index for the Gold Miners index closed yesterday at 22.39 and has generated a buy signal. These buy signals can last several months. What was unusual about this market was that it went down so fast it did not generate a sell signal, as the 10-day average of the Bullish Percent index stayed above 40%. It has now generated another buy signal by the RSI method described above. We are thinking that a "Sign of Strength" may still develop through the 31.00 GDX range in the coming weeks. Long GDX on 1/29/19 at 21.97.
Tim Ord,
Editor
www.ord-oracle.com. New Book release "The Secret Science of Price and Volume" by Timothy Ord, buy at www.Amazon.com.