
SPX Monitoring purposes: Long SPX on 3/23/20 at 2237.40
Monitoring purposes GOLD: Flat
Long Term Trend SPX monitor purposes: Flat
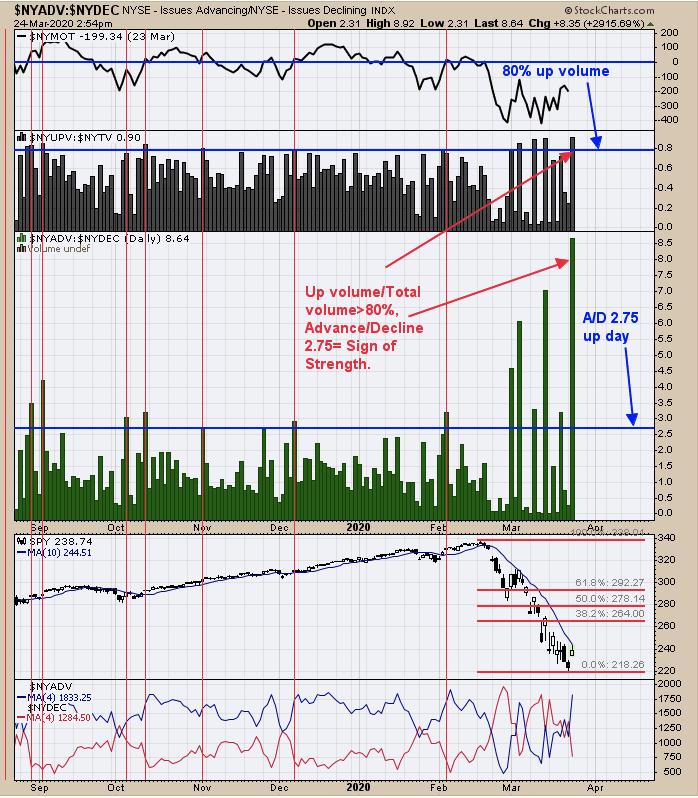
Today's rally produced a "Sign of Strength" both in the Advance/Decline line and the Up/Total volume indicators. This may be the best setup for the market to continue higher short-term. On previous large declines like in 2010, the SPX retraced over 61.8%, the 2011 period retraced near 38.2% and the first decline off of the top in 2008 retraced 38.2%. If tomorrow is up, it will be the first time since February 19 the market was up two days in a row and would imply a change of character. Long SPX on 3/23/20 at 2237.40.
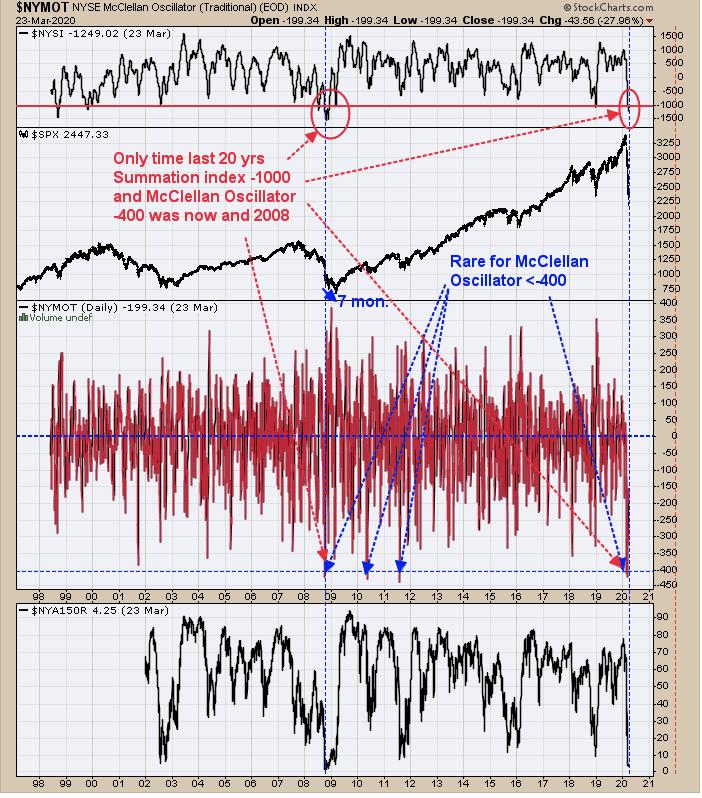
Yesterday, we said "Going back to 1998 the NYSE McClellan Oscillator hit -400 four times; the current timeframe and 2011, 2010 and 2008 and that is it, a rare occurrence. The last three times (shown above) the 2008 market stabilized for a month and chopped down into new lows. The 2010 the market flipped sideways for the next four months then rallied over the next several months. In 2011 the market flipped sideways for three months and then generally rallied for several months. It does appear the market has reached an area where a rally is possible short term." Added to the above is that the NYSE Summation index (top window) hit below -1000 only twice, once back in 2008 and the current timeframe. This addition information tilts the scales that the current decline is matching up to the 2008 timeframe. In the 2008 timeframe from this point, the decline lasted another 7 months, which gets very close to the election.
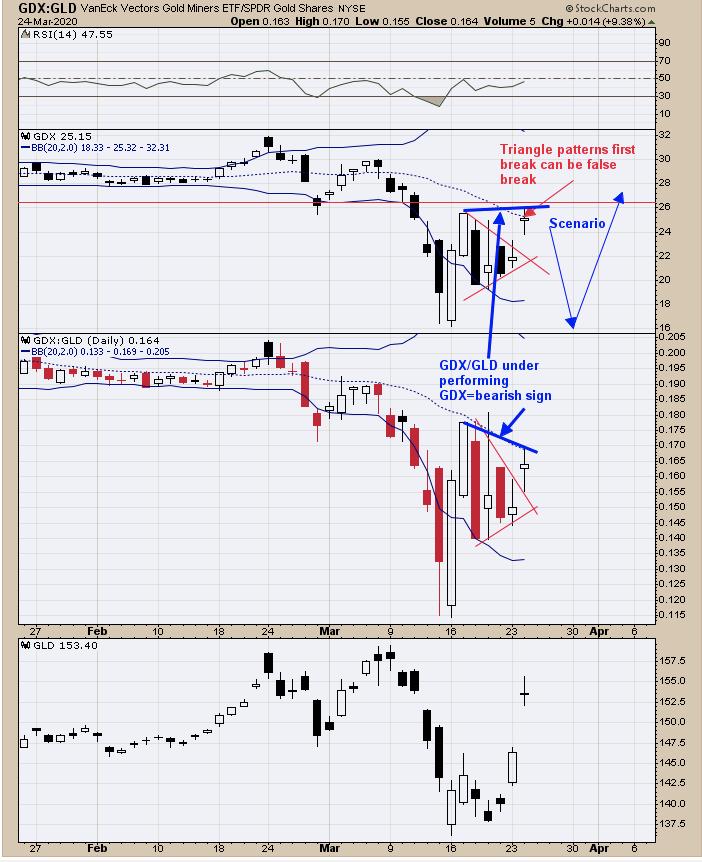
The pattern that appeared to have formed over the last several days on GDX is a Triangle pattern. It's common for the first breakout of a Triangle pattern to be a false break and, in a short time, the market reverses in the opposite direction. Triangle patterns usually go in the direction that preceded it and in the current case would be down. We also notice that GDX/GLD ratio is weaker than GDX and GDX/GLD ratio usually leads GDX. There is a possibility that GDX could retest the March 15 low in the coming days and would be an area where a buy setup could materialize. Being patient for now.
Tim Ord,
Editor
www.ord-oracle.com. New Book release "The Secret Science of Price and Volume" by Timothy Ord, buy at www.Amazon.com.